Deployments in Practice
The examples below are composites of common real-world deployments; they are not intended as templates to copy. They show how Horizon fits into an Operational Support System (OSS) stack, and how the deployment scenarios combine in practice. Few deployments start in their final form: most grow iteratively, adding components as specific needs appear rather than being built out all at once.
Availability and performance monitoring for an enterprise
An organization with a campus network and a dozen branch offices: roughly 1,500 nodes, mostly switches, routers, wireless controllers, and servers. The requirements are availability monitoring, SNMP performance data, and alerting.
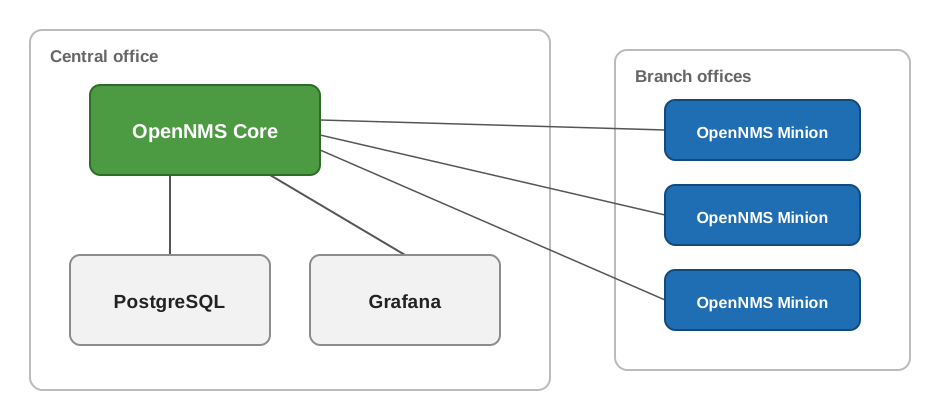
The deployment:
-
A single core host at the central office (single-host scenario) stores time series data on local SSD storage.
-
PostgreSQL runs on the organization’s existing database infrastructure (external PostgreSQL scenario), which already provides backups and DBA support.
-
One Minion runs in each branch office (Minion scenario). The branches sit behind firewalls, and each Minion makes a single outbound connection.
-
Grafana provides the dashboards through the OpenNMS Plugin for Grafana; the Horizon UI handles alarms, provisioning, and troubleshooting.
-
Notifications feed the team’s existing on-call tooling.
This deployment uses only the first three scenarios, matching components to the requirements it has. It can grow along the same path as needs change.
Collection and fault management for an upstream OSS
A network operator with equipment in many unstaffed locations, such as fiber exchanges and other equipment sites. The equipment reports faults primarily through SNMP traps, and an upstream system owns notifications and cross-domain correlation. Horizon serves as the collection and fault management layer between the two: it turns raw traps into alarms, correlates them, and streams them to the upstream system.
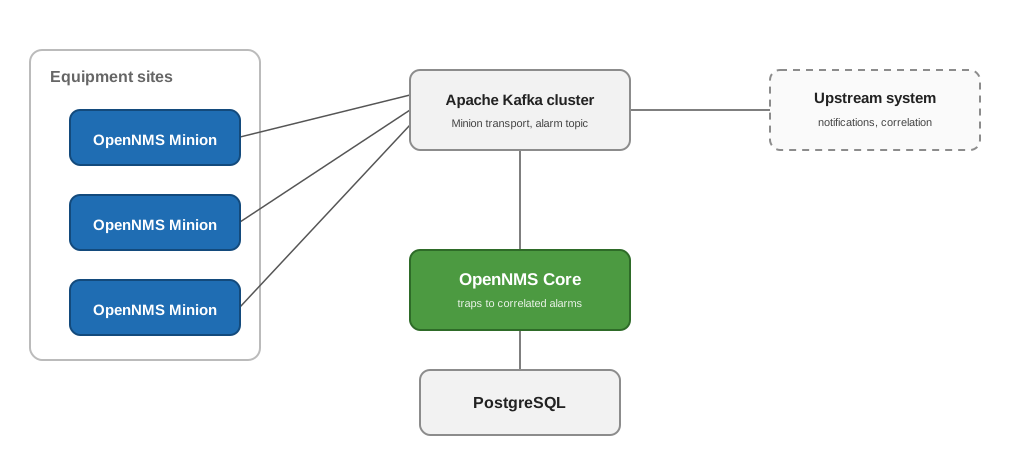
The deployment:
-
A Minion at each equipment location receives traps close to the source (Minion scenario) and reaches the core through an external Kafka cluster (external message broker scenario).
-
The core normalizes traps into events and raises alarms from them. Custom Drools rules extend the default correlation to match the operator’s alarm lifecycle, such as clearing, deduplication, and grouping of related alarms.
-
The Kafka Producer streams all alarms, and their subsequent updates, to a topic on the same Kafka cluster.
-
An upstream system consumes the alarm topic and handles notifications and further correlation. To Horizon it is a black box: no notification or ticketing configuration exists in Horizon itself.
In this stack, Horizon owns trap ingestion, event normalization, and alarm correlation; everything user-facing happens upstream. The operator’s concern here is faults, not performance data.
Metrics collection for a Prometheus-compatible stack
An organization that uses Horizon solely as a metrics collection engine, feeding a monitoring stack built on Prometheus-compatible tooling. This deployment is the opposite of the previous example: the concern is performance data, not faults.
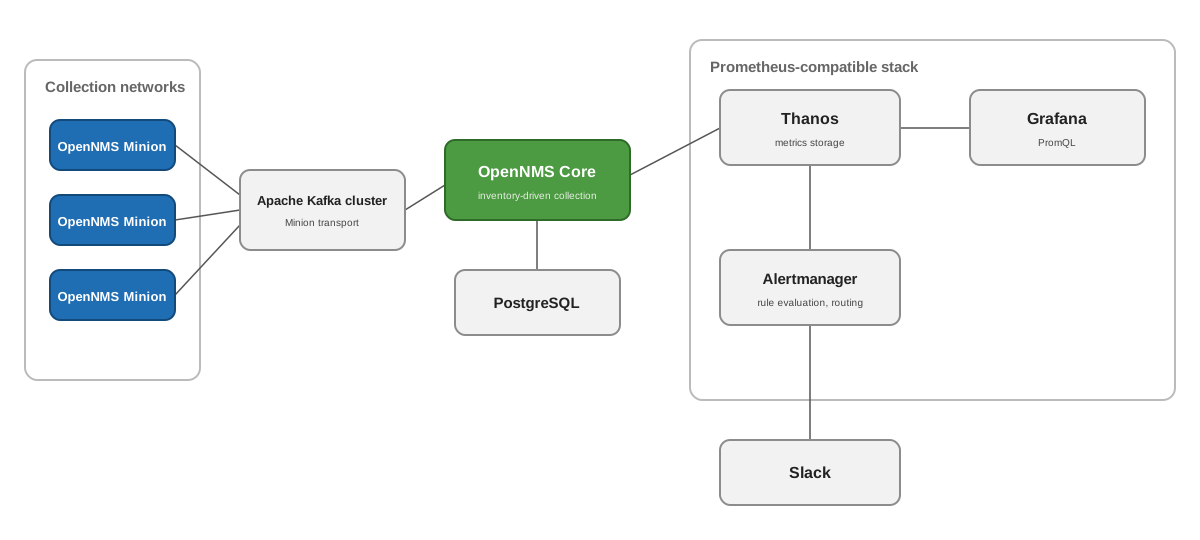
The deployment:
-
Minions in the collection networks (Minion scenario) gather SNMP metrics on a one-minute collection interval, faster than the default five-minute interval, and reach the core through an external Kafka cluster (external message broker scenario).
-
The Prometheus RemoteWrite plugin persists all collected metrics to Thanos (dedicated time series storage scenario); nothing is written to local RRD files. The fast collection interval multiplies write volume, which is the trigger for dedicated storage here.
-
Alerting on the metrics runs in the Prometheus ecosystem: an alerting component evaluates threshold rules, and Alertmanager routes notifications to a messaging tool such as Slack.
-
Grafana queries Thanos directly with PromQL through its Prometheus data source; the OpenNMS Plugin for Grafana is not needed in this pipeline.
In this stack, Horizon contributes inventory-driven collection at scale; metric storage, alerting, and dashboards live in the Prometheus ecosystem.
Flow monitoring for a service provider
A regional service provider: a few thousand nodes across several points of presence, with NetFlow and IPFIX exported from edge and core routers at sustained rates in the tens of thousands of flows per second. Traffic visibility is a primary product requirement.
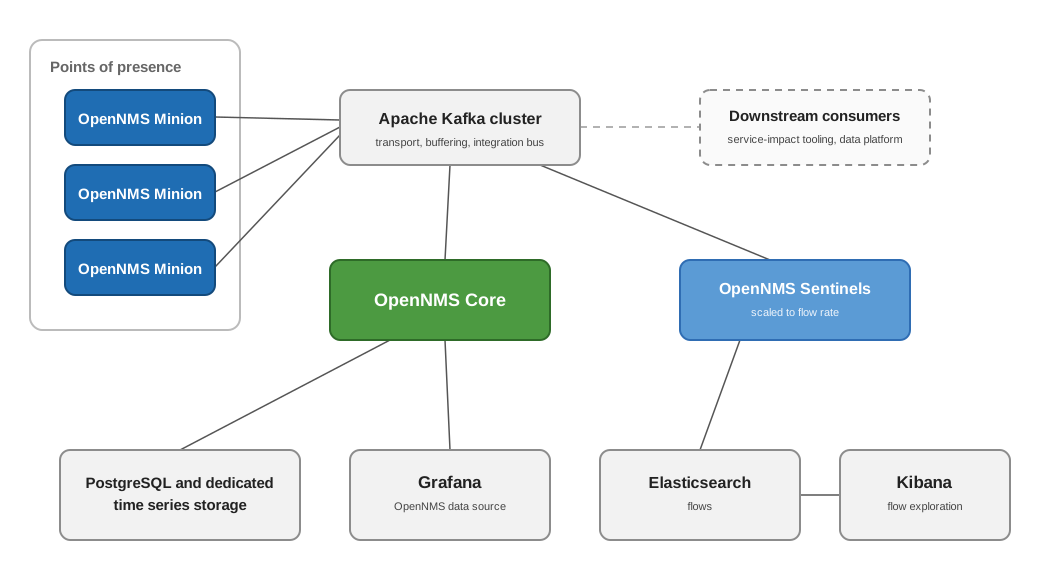
The deployment:
-
Minions in each POP receive flows and telemetry close to the exporters and handle polling within the POP (Minion scenario).
-
An Apache Kafka cluster carries Minion traffic and buffers flow data (external message broker scenario). Buffering is relevant here because flow volume spikes during network incidents, when visibility is most needed.
-
Sentinel instances consume and process the flow stream, with the instance count scaled to the flow rate. Raw flow processing does not reach the core.
-
An Elasticsearch cluster stores flows; PostgreSQL and dedicated time series storage hold the rest.
-
Grafana provides operational dashboards through the OpenNMS data source, and Kibana queries the Elasticsearch cluster directly for flow exploration.
-
The Kafka Producer streams alarms and events to Kafka topics consumed by the provider’s service-impact tooling and data platform. The same Kafka cluster serves the internal pipeline and the integration bus.
Even at this scale there is still one core; what scales out is reach (Minions), data processing (Sentinels), and storage (Elasticsearch, Kafka).