Operator Board
An operator board helps Network Operations Centers (NOCs) visualize network monitoring information. You can use and arrange customizable dashlets to display different types of information (alarms, availability maps, and so on) on the board. You can also create multiple operator boards and customize them for different user groups.
There are two visualization modes in which you can display dashlets:
-
Ops panel: Displays multiple dashlets on one page. Useful for displaying information in a centralized location (for example, on a NOC operator’s workstation).
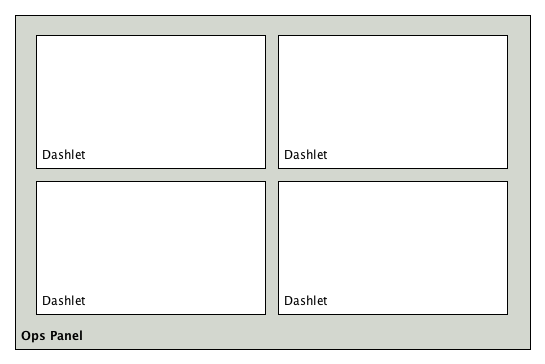 Figure 1. Four dashlets on an ops panel
 -
Ops board: Displays one dashlet at a time, in rotation. Useful for displaying a variety of information that users can view independently (for example, on a wall-mounted screen in a NOC).
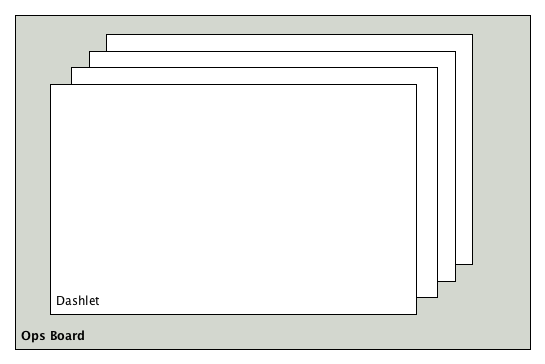 Figure 2. Four dashlets in rotation on an ops board
Configuration
You must have admin permissions to create and configure operator boards. After you create an operator board, you can specify how the information will be visualized (as a panel or a board).
Follow these steps to create a new operator board:
-
Click in the side menu.
-
Or, click in the side menu, then under Additional Tools, click Ops Board Configuration.
-
Click the plus symbol (+) beside the Overview tab, type a name for the new ops board, and click Save.
-
Click Add Dashlet, select a dashlet from the Dashlet list, and configure its settings:
-
Title: Dashlet name to display in the operator board.
-
Priority: How often the dashlet displays in the rotation. Priority 1 is the highest, meaning it appears the most often.
-
Duration: How long the dashlet displays in the rotation, in seconds.
-
Boost-Priority: Change the dashlet’s priority if it is in an alert state. This setting is optional, and is not available for all dashlets.
-
Boost-Duration: Change the display duration if the dashlet is in an alert state. This setting is optional, and is not available for all dashlets.
-
(Optional) Click Properties to configure additional settings (alarm severity, chart type, and so on).
-
-
Click the up arrow and down arrow symbols to change the dashlet’s order. This affects its rotation order in the ops board view, or its position in the ops panel view.
-
Click Preview in the dashlet settings area to preview the dashlet.
-
Click Preview beside the operator board name to preview the board and all of its dashlets.
The board’s configuration is automatically saved. To view the operator board, click in the top menu bar. Depending on the visualization you want to see, select either Ops Panel or Ops Board.
Dashlets
Each dashlet visualizes specific information:
-
Alarm Details: Displays a table with alarms and their details.
-
Alarms: Displays a table with a short description of alarms.
-
Charts: Displays predefined and custom bar graphs.
-
Grafana: Displays a Grafana dashboard with data spanning a specified time range.
-
Image: Displays a custom image.
-
KSC Reports: Displays a specified KSC report.
-
Map: Displays the geographical map.
-
RRD: Displays one or more RRD graphs.
-
RTC: Displays configured SLA categories.
-
Summary: Displays a trend of incoming alarms spanning a specified time range.
-
Surveillance: Displays a specified surveillance view.
-
URL: Displays the content of a defined web page or web application.
To filter the information displayed in a dashlet, configure it using a generic criteria builder.