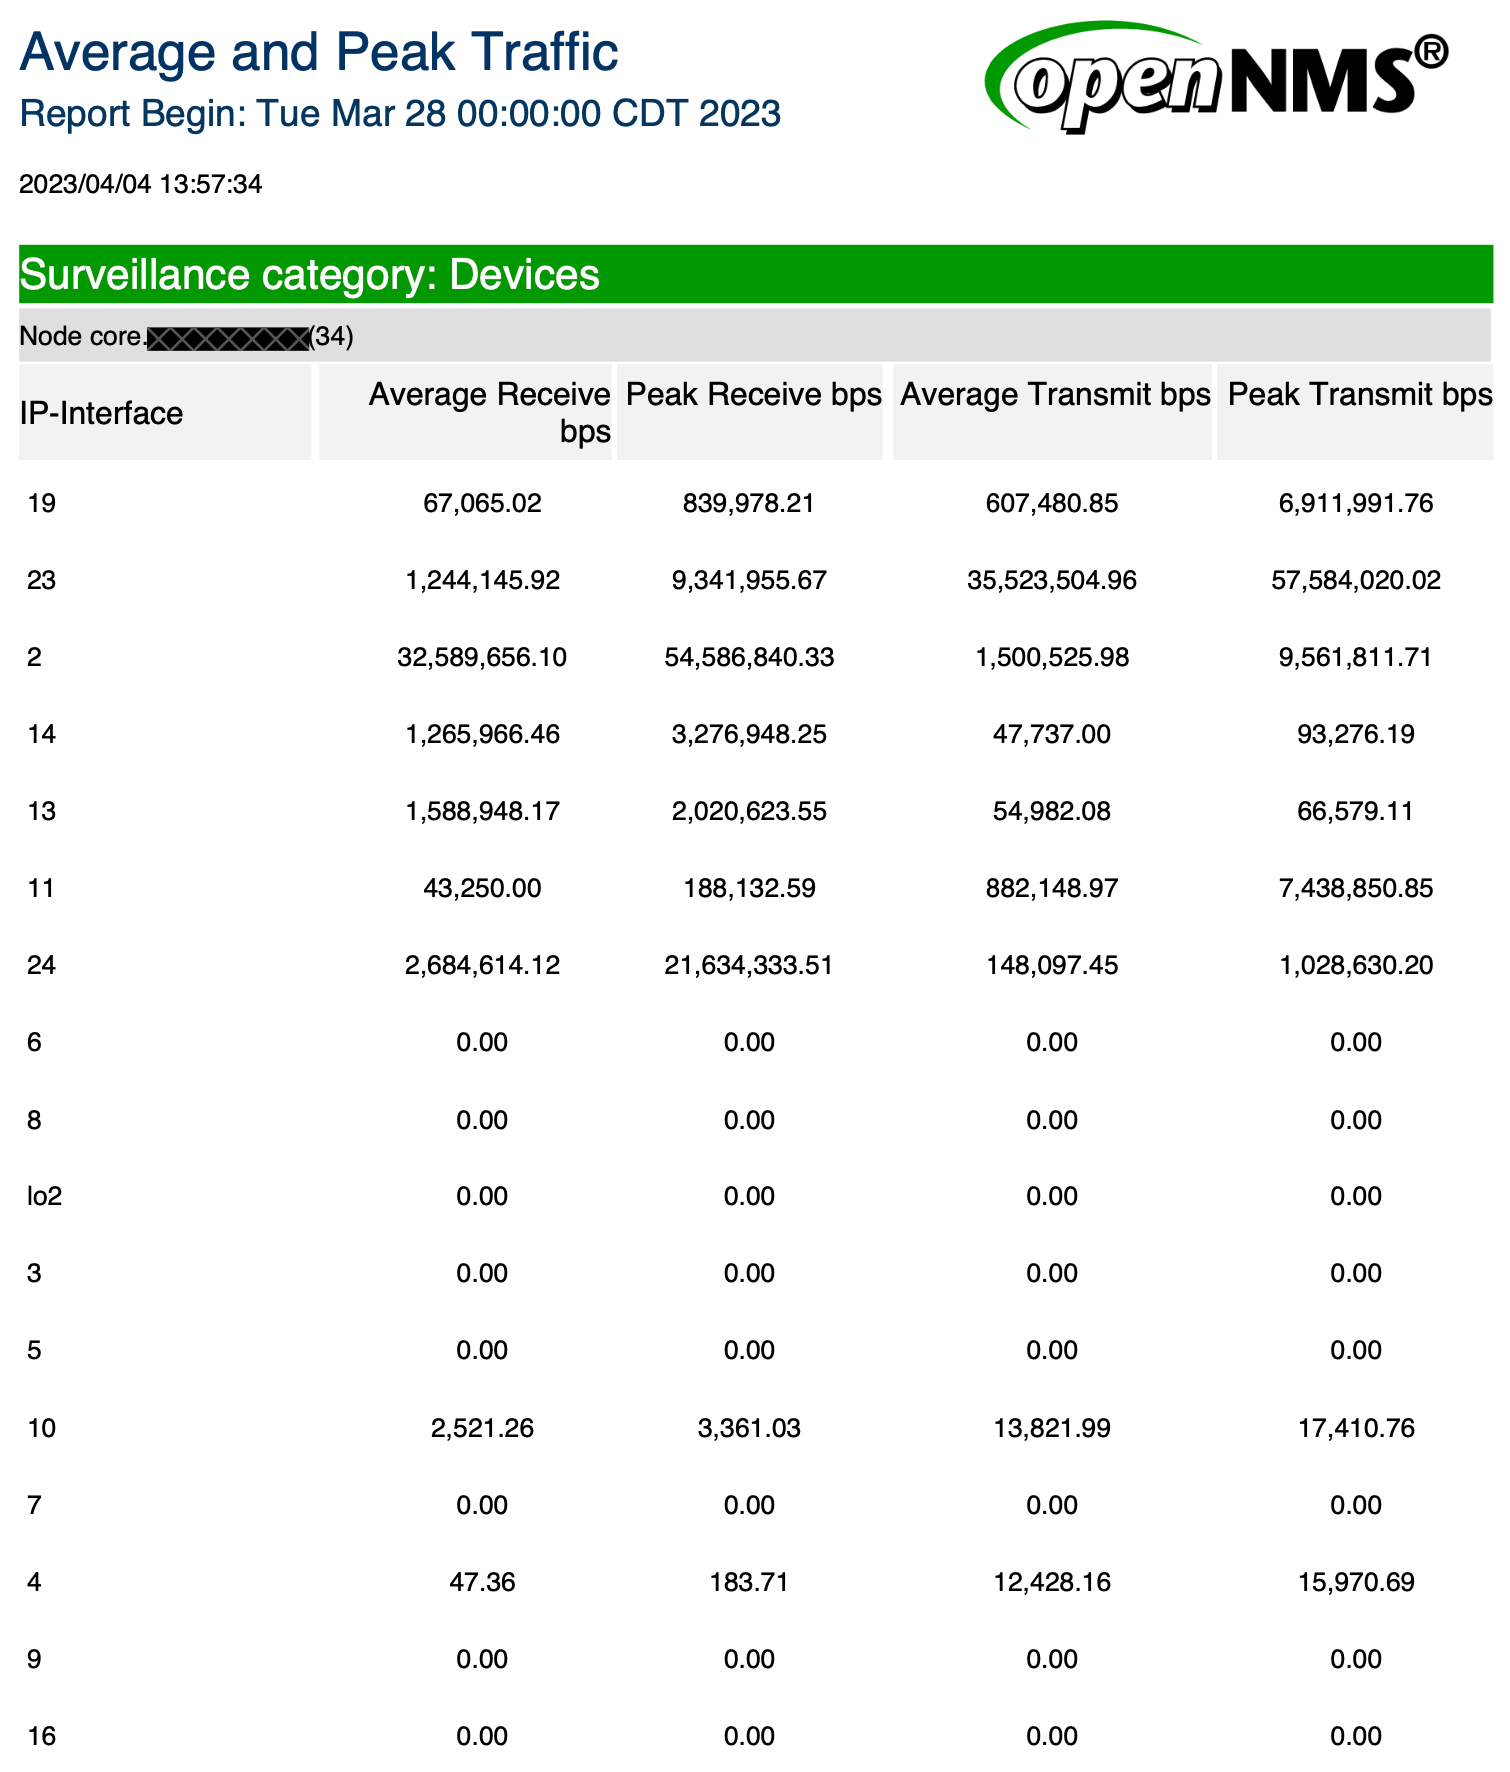
Traffic Rates for Nodes by Interface Report

This report provides a summary of the average and peak traffic rates for nodes whose category matches the specified node tag. The data is listed over a specified time period.

Example of an Average and Peak Traffic report. A table of nodes and interfaces in the Devices surveillance group is displayed with bits per second statistics.

You can customize this report with a company logo (approximately 195px by 50px) in the header and footer.

Parameters

Report customization parameters
Field Description Default Value

Surveillance Category

One or more node tags to include in the report. To select multiple tags, use wildcards as described below. If no tags match the entered string, the report will have no data.

%

Start Date

The starting date for the data contained in this report.

7 days before today

End Date

The end date for the data contained in this report. If the end date is later than the Start Date, the report will have no data.

Today

Click to learn more about using wildcards in text fields

Text fields allow the use of the percent character % as a wildcard.

To match every record, enter the percent character by itself as the value for the text field.

It can also be used with other characters, for example, typing prod% as the value for a text field will match all records that start with "prod" in that field.

Typing %prod% into the text field will match any record that has the four characters "prod" anywhere in that text field.

Any string that can be used in a PostgreSQL query element that uses the LIKE predicate operator will work.