Poller Packages
You can group service configurations into polling packages to define more complex monitoring configurations. This allows you to assign different service configurations to nodes. To assign a polling package to nodes, use the filter syntax.
Each polling package can have its own Downtime Model configuration. You can configure multiple packages, and an interface can exist in more than one package. This provides great flexibility for determining service levels on a given device.
<package name="example1"> (1)
  <filter>IPADDR != '0.0.0.0'</filter> (2)
  <include-range begin="1.1.1.1" end="254.254.254.254" /> (3)
<include-range begin="::1" end="ffff:ffff:ffff:ffff:ffff:ffff:ffff:ffff" /> (3)| 1 | The polling package’s unique name. |
| 2 | Base filter on IP address, categories, or asset attributes of nodes based on filter rules.
The filter is evaluated first and is required.
This package is used for all IP interfaces that do not have 0.0.0.0 as an assigned IP address and is required. |
| 3 | Allows you to specify if the configuration of services is applied on a range of IP interfaces (IPv4 or IPv6). |
Instead of using include-range, you can add one or more specific IP interfaces:
<specific>192.168.1.59</specific>You can also exclude IP interfaces:
<exclude-range begin="192.168.0.100" end="192.168.0.104"/>Response time configuration
When using RRD/JRB storage, data is stored in the file system using a RRD-type strategy. With this "round robin" storage, data is kept in aggregated time buckets, with the latest bucket overwriting the oldest bucket. Multiple collections within the time period for a bucket will cause the data to be consolidated based on the type of bucket.
The aggregation buckets are defined in various config files based on a <RRD>…</RRD> block.
<rrd step="300">(1)
   <rra>RRA:AVERAGE:0.5:1:2016</rra>(2)
   <rra>RRA:AVERAGE:0.5:12:1488</rra>(3)
   <rra>RRA:AVERAGE:0.5:288:366</rra>(4)
   <rra>RRA:MAX:0.5:288:366</rra>(5)
   <rra>RRA:MIN:0.5:288:366</rra>(6)
</rrd>| 1 | Step of 300 seconds (5 minutes) per bucket. This value should match the interval of the services in the package. |
| 2 | Store the average of 1 bucket for 2016 buckets. 5-minute averages kept for 7 days. |
| 3 | Store the average of 12 buckets for 1488 buckets. 1-hour average kept for 62 days. |
| 4 | Store the average of 288 buckets for 366 buckets. 1-day average kept for 366 days. |
| 5 | Store the maximum of 288 buckets for 366 buckets. 1-day max kept for 366 days. |
| 6 | Store the minimum of 288 buckets for 366 buckets. 1-day min kept for 366 days. |
| If the RRD definition is modified after data has been collected, you must manually delete the existing RRD/JRB files on disk so they can be recreated with the updated definition. |
When using another storage strategy, such as Newts, Cortex, or other integration, all collected data points are persisted without aggregation.
These points will be kept until the configured TTL expires.
These storage strategies will ignore any defined <RRA> definitions in favor of the TTL value.
Service status persistence
By default service monitors store their current service status in RRD files.
This lets you query the current status and the status history.
This feature is enabled by default.
To disable this feature for individual services, add a service parameter to the appropriate services in poller-configuration.xml:
<service name="EXAMPLE" ...>
  <parameter key="rrd-status" value="false"/>
</service>
The value stored is an enum value based on the status of the polled service.
If the poller service is not able to run, such as due to an error in the monitor config, the stored value will be NaN.
| Monitor Response | Stored Value |
|---|---|
Available |
1 |
Unavailable |
0 |
Unresponsive |
-1 |
Overlapping services
Because you can specify multiple polling packages, you can use the same service (like ICMP) multiple times.
The order that polling packages are defined in poller-configuration.xml is important when IP interfaces match multiple polling packages with the same service configuration.
The following shows which configuration is applied for a specific service:
<package name="less-specific">
  <filter>IPADDR != '0.0.0.0'</filter>
  <include-range begin="1.1.1.1" end="254.254.254.254" />
  <include-range begin="::1" end="ffff:ffff:ffff:ffff:ffff:ffff:ffff:ffff" />
  <rrd step="300"> (1)
    <rra>RRA:AVERAGE:0.5:1:2016</rra>
    <rra>RRA:AVERAGE:0.5:12:1488</rra>
    <rra>RRA:AVERAGE:0.5:288:366</rra>
    <rra>RRA:MAX:0.5:288:366</rra>
    <rra>RRA:MIN:0.5:288:366</rra>
  </rrd>
  <service name="ICMP" interval="300000" user-defined="false" status="on"> (2)
    <parameter key="retry" value="5" /> (3)
    <parameter key="timeout" value="10000" /> (4)
    <parameter key="rrd-repository" value="/var/lib/opennms/rrd/response" />
    <parameter key="rrd-base-name" value="icmp" />
    <parameter key="ds-name" value="icmp" />
  </service>
  <downtime interval="30000" begin="0" end="300000" />
  <downtime interval="300000" begin="300000" end="43200000" />
  <downtime interval="600000" begin="43200000" end="432000000" />
</package>

<package name="more-specific">
  <filter>IPADDR != '0.0.0.0'</filter>
  <include-range begin="192.168.1.1" end="192.168.1.254" />
  <include-range begin="2600::1" end="2600:::ffff" />
  <rrd step="30"> (1)
    <rra>RRA:AVERAGE:0.5:1:20160</rra>
    <rra>RRA:AVERAGE:0.5:12:14880</rra>
    <rra>RRA:AVERAGE:0.5:288:3660</rra>
    <rra>RRA:MAX:0.5:288:3660</rra>
    <rra>RRA:MIN:0.5:288:3660</rra>
  </rrd>
  <service name="ICMP" interval="30000" user-defined="false" status="on"> (2)
    <parameter key="retry" value="2" /> (3)
    <parameter key="timeout" value="3000" /> (4)
    <parameter key="rrd-repository" value="/var/lib/opennms/rrd/response" />
    <parameter key="rrd-base-name" value="icmp" />
    <parameter key="ds-name" value="icmp" />
  </service>
  <downtime interval="10000" begin="0" end="300000" />
  <downtime interval="300000" begin="300000" end="43200000" />
  <downtime interval="600000" begin="43200000" end="432000000" />
</package>| 1 | Polling interval for the packages is 300 seconds and 30 seconds. |
| 2 | Custom polling interval for the ICMP service. |
| 3 | Custom retry settings for the ICMP service. |
| 4 | Custom timeout settings for the ICMP service. |
The last polling package on the service will be applied.
You can use this to define a less specific catch-all filter as the default configuration.
Use a more specific polling package to overwrite the default settings.
In the previous example, all IP interfaces in 192.168.1/24 or 2600:/64 will be monitored with ICMP using custom polling, retry, and timeout settings.
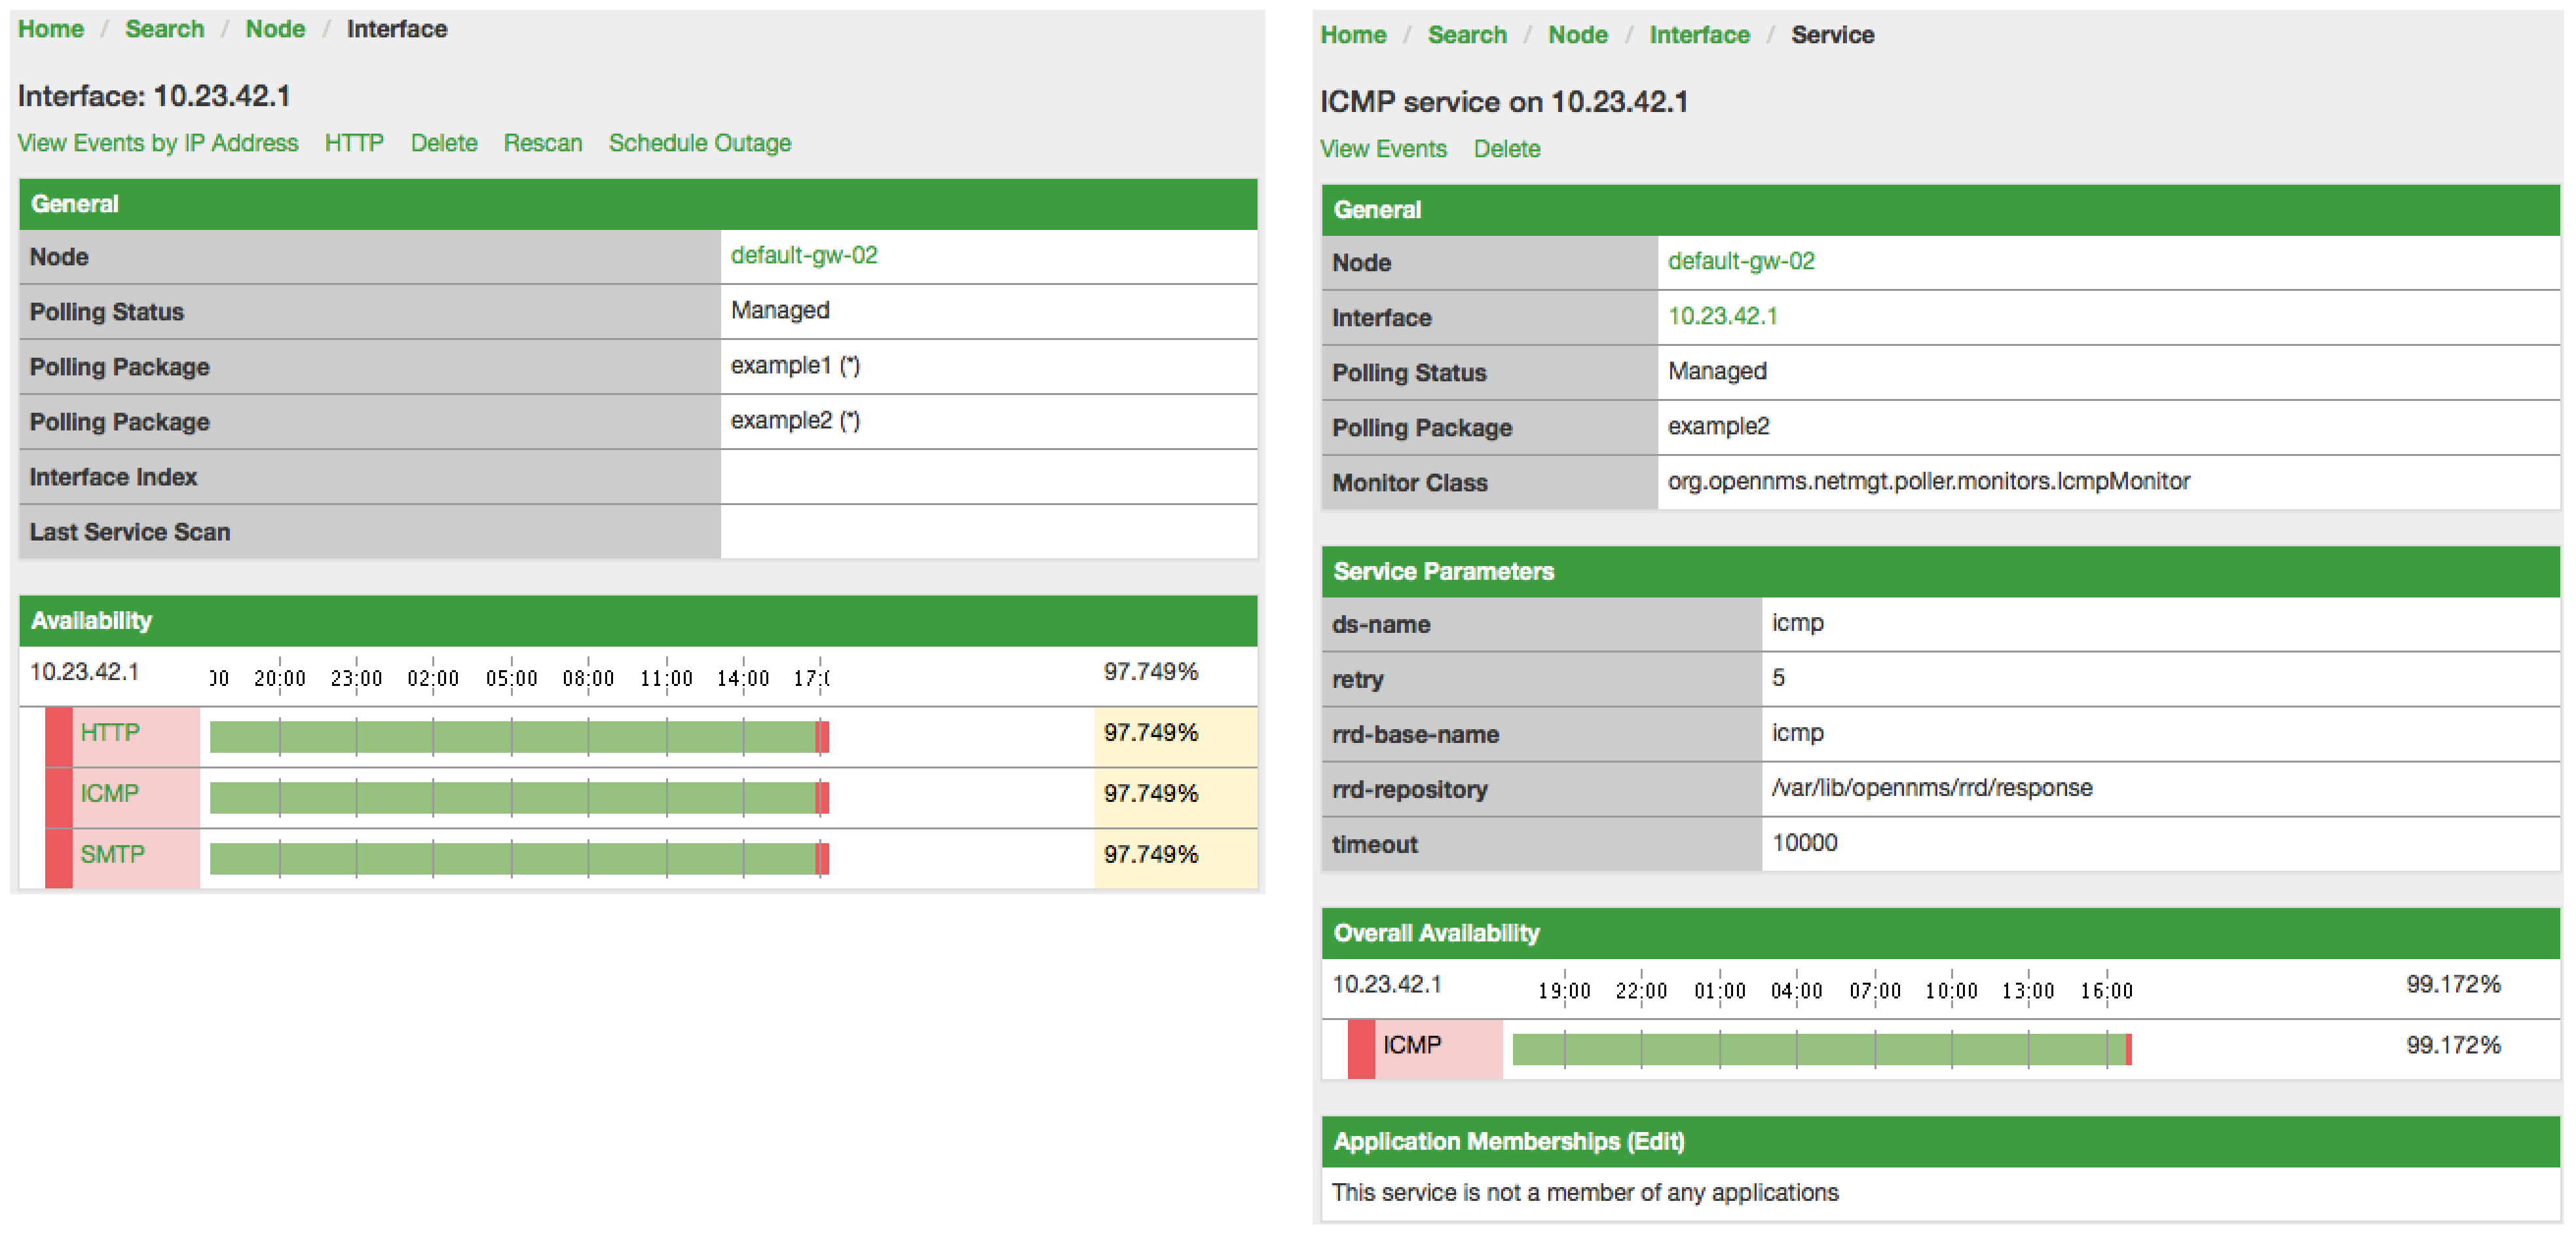
The IP interface and service pages show which polling package and service configuration are applied for this specific service, and associated statistics.
Service patterns
Usually, the poller that monitors a service is found by matching its name with the service name.
There is an option for you to match a poller if you specify an additional pattern element.
If so, the poller is used for all services matching the regex pattern.
The regex pattern lets you specify named capture groups. There can be multiple capture groups inside a pattern, but each must have a unique name. Note that the regex must be escaped or wrapped in a CDATA tag inside the configuration XML to make it a valid property.
If a poller is matched using its pattern, the parts of the service name that match the capture groups of the pattern are available as parameters to the Metadata DSL using the context pattern and the capture group name as key.
Examples
-
<pattern><![CDATA[^HTTP-(?<vhost>.*)$]]></pattern>: matches all services with names starting withHTTP-followed by a host name. If the service is calledHTTP-www.example.com, the Metadata DSL expression${pattern:vhost}will resolve towww.example.com. -
<pattern><![CDATA[^HTTP-(?<vhost>.*?):(?<port>[0-9]+)$]]></pattern>: matches all services with names starting withHTTP-followed by a hostname and a port. There will be two variables (${pattern:vhost}and${pattern:port}), which you can use in the poller parameters.
Use the service pattern mechanism whenever there are multiple instances of a service on the same interface. You can make services identifiable by specifying a distinct service name for each instance, but there is no need to add a poller definition for each service. Common use cases for such services are HTTP virtual hosts where multiple web applications run on the same web server, or BGP session monitoring where each router has multiple neighbors.
Manually test services
You can run a test via the Karaf shell to test the Meridian polling services:
ssh -p 8101 admin@localhost
In the shell, you can use opennms:poll --help to view the command’s help information.
|
The following example runs the ICMP monitor on a specific IP interface:
opennms> opennms:poll -S ICMP -P example1 10.23.42.1The output is verbose, which lets you debug monitor configurations. Important output lines include the following:
Package: example1 (1)
Service: ICMP (2)
Monitor: org.opennms.netmgt.poller.monitors.IcmpMonitor (3)
Parameter ds-name: icmp (4)
Parameter retry: 2 (5)
Parameter rrd-base-name: icmp (4)
Parameter rrd-repository: /opt/opennms/share/rrd/response (4)
Parameter timeout: 3000 (5)

Service is Up on 192.168.31.100 using org.opennms.netmgt.poller.monitors.IcmpMonitor: (6)
response-time: 407,0000 (7)| 1 | Service and package of this test. |
| 2 | Applied service configuration from polling package for this test. |
| 3 | Service monitor used for this test. |
| 4 | RRD configuration for response time measurement. |
| 5 | Retry and timeout settings for this test. |
| 6 | Polling result for the service polled against the IP address. |
| 7 | Response time. |
Manually test filters
Filters are ubiquitous in the Meridian configurations that implement <filter> syntax.
You can use the Karaf shell to verify filters.
For more information, see Filters.
ssh -p 8101 admin@localhost
In the shell, you can use opennms:filter --help to view the command’s help information.
|
For example, you can run a filter rule that matches a location:
opennms:filter "location='MINION'"The output displays as follows:
nodeId=2 nodeLabel=00000000-0000-0000-0000-000000ddba11 location=MINION
	IpAddresses:
		127.0.0.1
You can also run a filter that matches a node location within a given IP address range:
opennms:filter "location='Default' & (IPADDR IPLIKE 172.*.*.*)"The output displays as follows:
nodeId=3 nodeLabel=label1 location=Default
	IpAddresses:
		172.10.154.1
		172.20.12.12
		172.20.2.14
		172.01.134.1
		172.20.11.15
		172.40.12.18

nodeId=5 nodeLabel=label2 location=Default
	IpAddresses:
		172.17.0.111

nodeId=6 nodeLabel=label3 location=Default
	IpAddresses:
		172.20.12.22
		172.17.0.123
Displayed node information includes the nodeId, nodeLabel, location, and optional fields like foreignId, foreignSource, and categories (when they exist).
|
Monitor Microsoft AD services
To monitor Microsoft AD services, you must edit ${OPENNMS_HOME}/etc/poller-configuration.xml.
See the Monitor Microsoft AD Services article on Discourse for more information.