Thresholding Tasks
For information on how to create a basic or expression-based threshold, see Step 5: Set up a Threshold in the Quick Start section. This section describes related thresholding tasks.
Use metadata in a threshold
Metadata in expression-based thresholds can streamline threshold creation. The Metadata DSL (domain specific language) lets you use patterns in an expression, whereby the metadata is replaced with a corresponding value during the collection process. A single expression can behave differently based on the node that it is tested against.
During evaluation of an expression, the following scopes are available:
-
Node metadata
-
Interface metadata
-
Service metadata
Metadata is also supported in the value, re-arm, and trigger fields for Single-DS and expression-based thresholds. For more information on metadata and how to define it, see Metadata.
Example
This procedure uses metadata to trigger an event when the number of logged-in users exceeds one.
The expression is in the form ${context:key|context_fallback:key_fallback|…|default}.
Before using metadata in a threshold, you need to add the metadata context pair—-in this case, a requisition key called userLimit (see Adding metadata through the web UI).
Follow these steps to create the expression-based threshold:
-
Click in the side menu.
-
Or, click in the side menu, then under Performance Management, click Configure Thresholds.
-
Click Edit beside the
netsnmpgroup. -
Click Create New Expression-based Threshold.
-
Fill in the following information:
-
Type: High
-
Expression:
hrSystemNumUsers / ${requisition:userLimit|1} -
Datasource type: Node
-
Value: 1
-
Rearm: 1
-
Description: Too many logged-in users
-
Expression label: User limit above 1
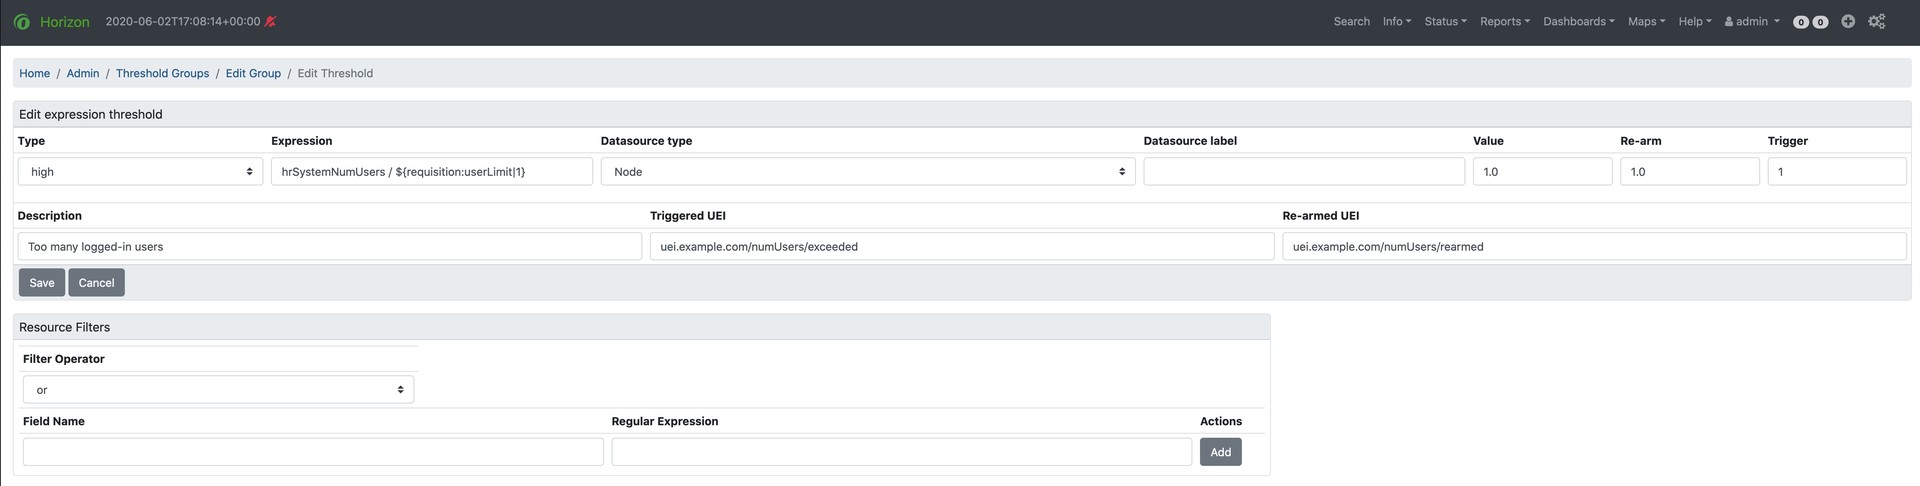 Figure 1. Example expression-based threshold configuration
-
-
Click Save.
This expression will trigger an event when the number of logged-in users exceeds one.
Confirm that you are collecting metrics
Before creating a threshold, you should make sure that you are collecting the metric against which you want to threshold:
-
Choose in the side menu.
-
Select one of the listed resources.
-
Under SNMP Node Data, select .
-
Scroll to find the graph for the metric you want to threshold.
You can click the binoculars symbol to display only that graph.
Determine the data source
Creating a threshold requires the name of the data source generating the metrics on which you want to threshold.
Data source names for the SNMP protocol appear in etc/snmp-graph.properties.d.
To determine the name of the data source, navigate to the Resource Graphs screen:
-
Choose in the side menu.
-
Select one of the listed resources.
-
Under SNMP Node Data, select .
-
Scroll through the graphs to find the title of the graph that displays the metric on which you want to threshold. For example, "Number of Processes" or "System Uptime":
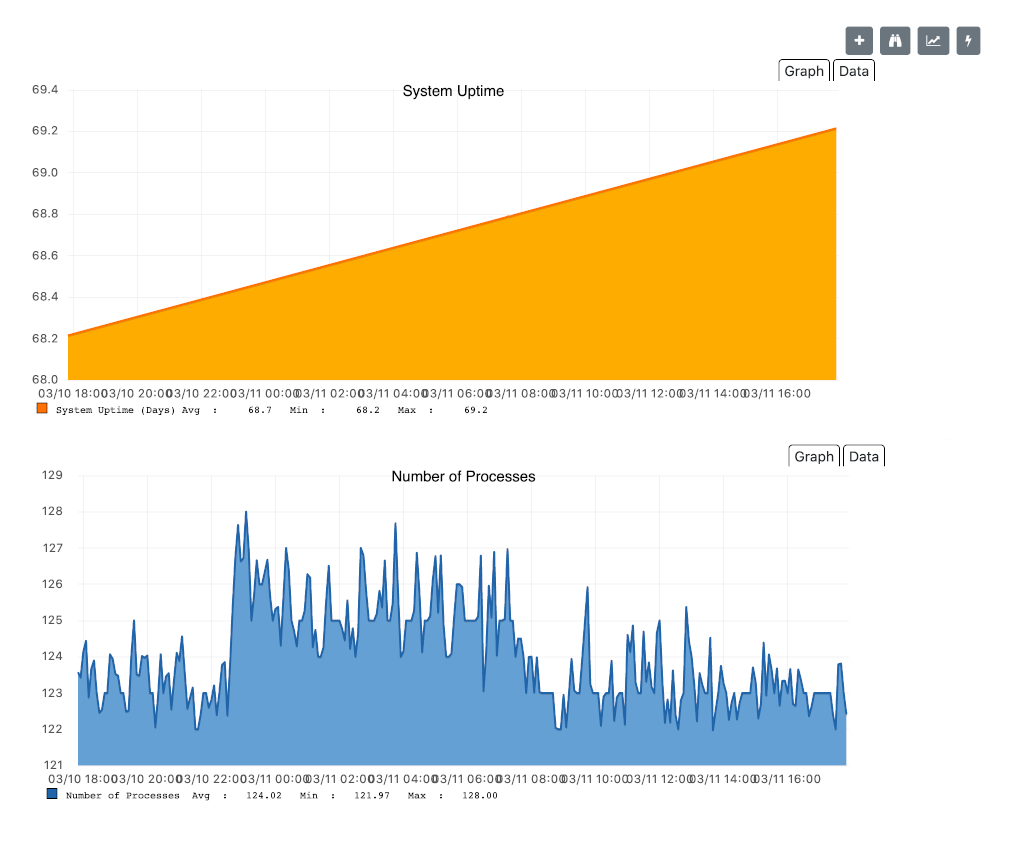 Figure 3. Meridian performance data metric graphs
 -
Go to
etc/snmp-graph.properties.dand search for the title of the graph (for example, "System Uptime"). -
Note the name of the data source (found as columns for the graph report properties), and enter it as the Datasource box when you create your threshold.
Thresholding on response times from polled services
To leverage response times from polled services as part of a threshold, you must ensure that the service has thresholding enabled by setting a parameter in the $OPENNMS_HOME/etc/pollerd-configuration.xml file.
As an example, the following configuration for the HTTP service will enable thresholding by setting the thresholding-enabled parameter to true:
      <service name="HTTP" interval="300000" user-defined="false" status="on">
         <parameter key="retry" value="${requisition:poller-retry|requisition:retry|detector:retry|1}" />
         <parameter key="timeout" value="${requisition:poller-timeout|requisition:timeout|detector:timeout|3000}" />
         <parameter key="port" value="${requisition:port|detector:port|80}" />
         <parameter key="url" value="${requisition:url|detector:url|/}" />
         <parameter key="rrd-repository" value="/opt/opennms/share/rrd/response" />
         <parameter key="rrd-base-name" value="http" />
         <parameter key="ds-name" value="http" />
         <parameter key="thresholding-enabled" value="true"/>
      </service>
The rrdRepository attribute of the thresholding group in $OPENNMS_HOME/etc/thresholds.xml must contain the appropriate path to the response repository. In the the example below, the path is /opt/opennms/share/rrd/response.
Additionally, response time thresholds must be interface (if) type.
Below is an example section from $OPENNMS_HOME/etc/thresholds.xml:
   <group name="high-network-latency" rrdRepository="/opt/opennms/share/rrd/response/">
      <threshold description="High Latency for Interface" type="high" ds-type="if" value="1000" rearm="200" trigger="3" filterOperator="OR" ds-name="http"/>
   </group>
To complete the example, the thresholding package definition from $OPENNMS_HOME/etc/threshd-configuration.xml :
   <package name="iot-network-latency">
      <filter>IPADDR != '0.0.0.0' </filter>
      <include-range begin="1.1.1.1" end="254.254.254.254"/>
      <include-range begin="::1" end="ffff:ffff:ffff:ffff:ffff:ffff:ffff:ffff"/>
      <service name="HTTP" interval="300000" user-defined="false" status="on">
         <parameter key="thresholding-group" value="high-network-latency"/>
      </service>
   </package>