Deployment Scenarios
A deployment can start with the smallest system that meets current needs and add components when a specific limit appears. Every additional component is another system to install, secure, monitor, and upgrade, so there is a cost to deploying ahead of need. The scenarios below are ordered by growth and scaling needs, reflecting common patterns of growth and change we see across deployments; each scenario builds on the previous one, and each lists the trigger that usually motivates it. Each scenario describes a single expansion step; Deployments in Practice shows complete environments that combine several of them.
| The sizing figures on this page are rough orders of magnitude, not benchmarks or guarantees, and actual capacity varies widely with hardware, collection intervals, retention, and the mix of monitored services. The figures can help judge whether a scenario is plausible for an environment, but you should verify them against your own workload. |
Everything on one host
A single server runs the core, PostgreSQL, and time series storage (RRDtool by default) on local disk, with the embedded ActiveMQ broker. This is the deployment the installation guide produces, and it is suitable for production use as well as evaluation.
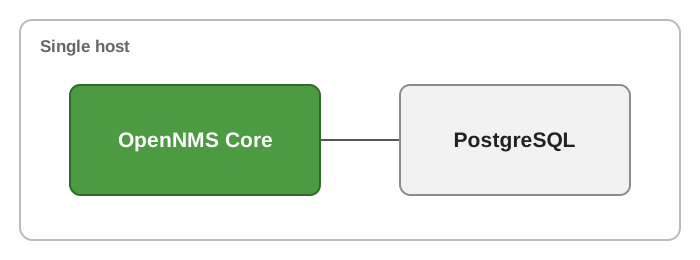
As a rough guide, a single well-resourced host can handle hundreds to a few thousand nodes with default collection intervals. Because the core, PostgreSQL, and time series storage share one machine, the limit is usually contention for its CPU, memory, and disk I/O rather than any single component. Database I/O is often the first pressure point, as inventory and event data grow.
Many organizations never need more than this scenario. It is also the recommended starting point for evaluations, regardless of the expected final size: the later scenarios build on this one without reinstallation.
Minions for reach
Trigger: Parts of the network that the core cannot reach directly, such as remote sites, networks behind firewalls or NAT, or overlapping RFC 1918 address space; or monitoring that should happen from a remote user’s perspective.
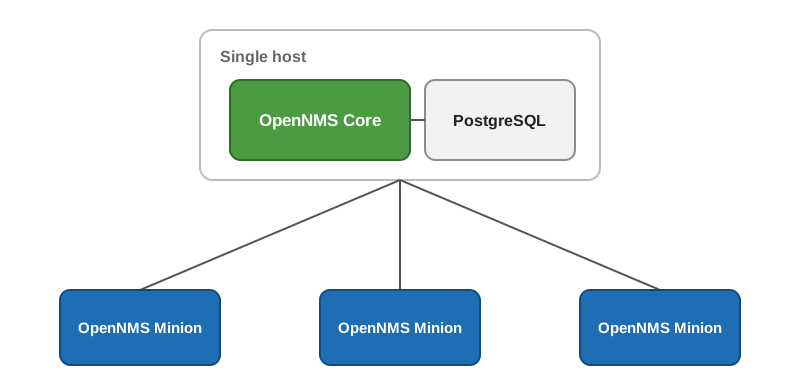
A Minion is a lightweight component deployed inside the remote network. It runs pollers and collectors locally, receives traps, syslog, and flows close to their source, and communicates with the core over a single authenticated connection.
Reach is the primary reason to add Minions, but they also relieve capacity. A Minion executes the polls and collections for its location, so the network I/O and the worst-case timeout and retry load described in Knowing the limits fall on the Minion rather than the core. The core still schedules that work and persists and correlates the results, so a busy Minion site adds to the core’s central load, and Minions do not scale out correlation or persistence. At small Minion counts, the embedded ActiveMQ broker is typically sufficient. A growing Minion fleet is one of the triggers for the external message broker.
External PostgreSQL
Trigger: The database competing with the core for I/O and memory, or organizational requirements such as existing backup and high-availability practices or a DBA team that manages PostgreSQL as a service.
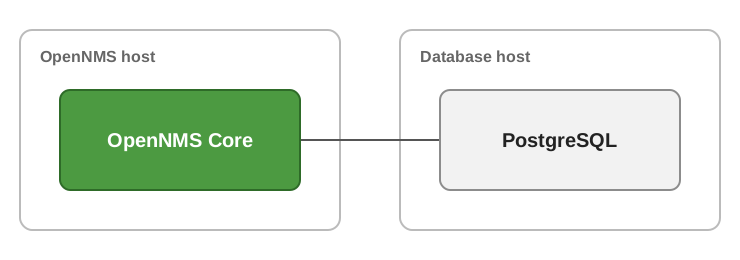
Moving PostgreSQL to dedicated hardware or a managed instance is usually a small operational change, and it is often done from the start when a database platform already exists. It also enables standard PostgreSQL replication and backup tooling without any Horizon-specific work.
External message broker
Trigger: A Minion fleet that has outgrown the embedded ActiveMQ broker, a need for a more resilient transport between Minions and the core, or a plan to use the broker as an integration bus for other systems.
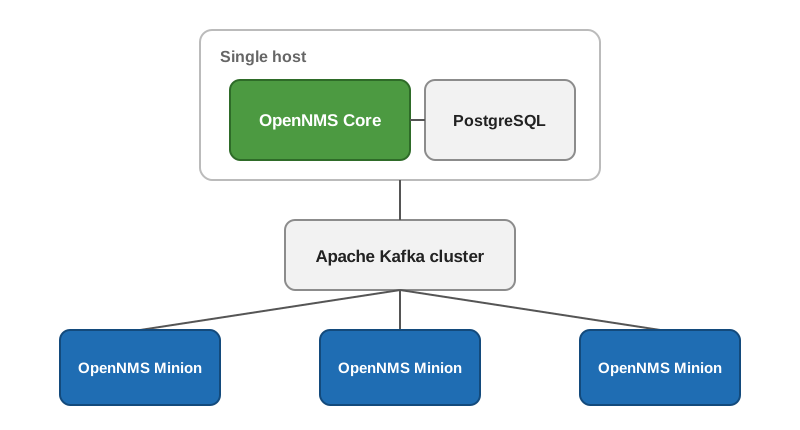
The embedded ActiveMQ broker is convenient for a small number of Minions but is not intended for production workloads at scale. An external Apache Kafka cluster replaces it as the transport between Minions and the core, handling higher message volumes and buffering traffic when connectivity is interrupted. The same cluster can later carry flow and telemetry data to Sentinel (see Sentinel and scale-out flows) and serve as an integration point for other systems.
Dedicated time series storage
Trigger: A need for capabilities that local RRD storage does not provide. Common reasons are finer control over retention and downsampling, consolidating metrics into a time series database already used elsewhere, querying the metrics directly from other tools, and data availability, since a clustered time series database provides redundancy that local storage on a single host does not.
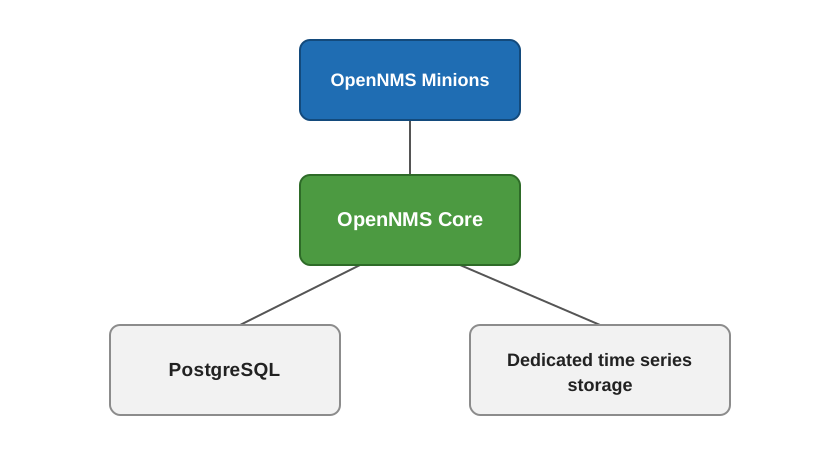
The time series layer is pluggable; time series integration plugins connect dedicated backends such as VictoriaMetrics. Migrating existing time series data between storage technologies is difficult and usually lossy, so this choice is harder to revisit than the others on this page.
Local RRD storage is comparatively lightweight and handles substantial workloads, so this step is usually driven by these capability needs rather than by disk pressure.
Sentinel and scale-out flows
Trigger: Flow or streaming telemetry volumes competing with the core’s other work.
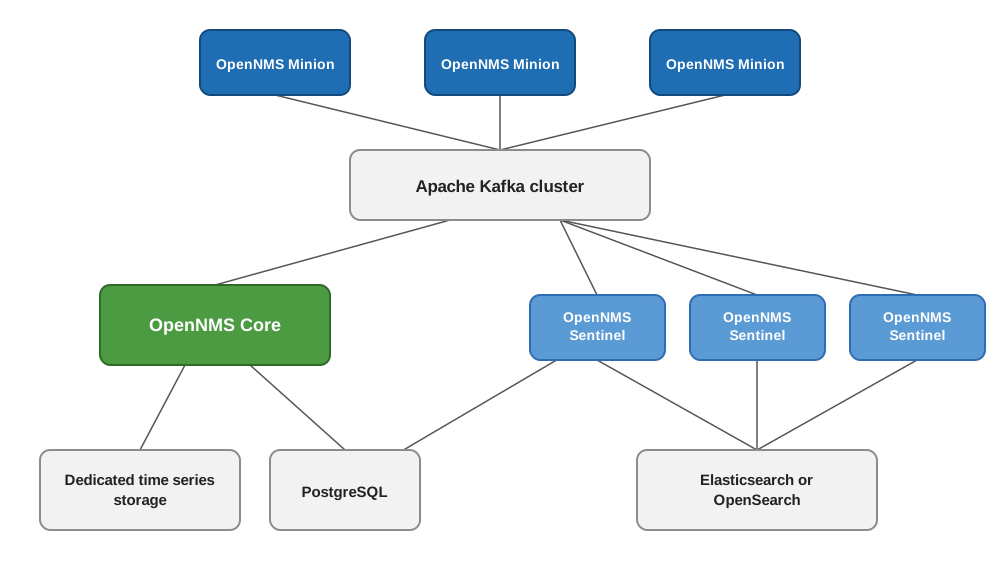
This scenario builds on the external message broker, which carries flow and telemetry data alongside Minion traffic:
-
Sentinel instances consume flow and telemetry data from Kafka and process it in place of the core. Sentinel scales horizontally: additional instances add processing capacity.
-
An Elasticsearch or OpenSearch cluster stores flows at high volumes; as a rough order of magnitude, this means sustained rates in the tens of thousands of flows per second.
Knowing the limits
The scenarios above extend reach, storage, and data processing, but they share one core instance, and the core does not cluster: polling and collection scheduling, event and alarm correlation, provisioning, and the web application all run there. Even so, a single core with the supporting components in place scales to very large environments, and deployments monitoring hundreds of thousands of nodes from one core exist.
Node count alone is a weak measure of load. What a deployment sustains depends on the mix of work behind those nodes: the services and metrics collected per node, the polling and collection intervals, the volume of flows and events, and how the deployment is tuned. A few nodes polled frequently across many services can outweigh many lightly monitored ones.
Size for the worst case, not the steady state. An unreachable service holds a poller thread for the full timeout on each attempt and retries according to its configuration, and the downtime model polls a down service frequently at first, then backs off for prolonged outages. A large outage makes many services time out at once, generating far more concurrent polling work than normal operation, so leave headroom for it. For a deeper discussion, see the community post on OpenNMS in large environments.
If requirements exceed what one fully expanded core can do, the usual approach is more than one deployment, split by region, business unit, or function, with a shared layer above them: a dashboard tool such as Grafana that queries several instances, or a Kafka pipeline that aggregates their events and alarms. High availability likewise uses standby instances and infrastructure-level failover rather than active-active clustering, and either is easier when the split follows a boundary that already exists in the organization.