Service Assurance
This section describes how Horizon tests the availability of a service or device and measures its latency. In Horizon, a service monitor framework fulfills these tasks. The main component, pollerd, provides the following functionality:
-
Tracks the status of a management resource or an application for availability calculations.
-
Measures response times for service quality.
-
Correlates node and interface outages based on a critical service.
See Step 7: Determine Service Availability in the Quick Start section for additional information on determining service availability.
The following image shows the model and representation of availability and response time:
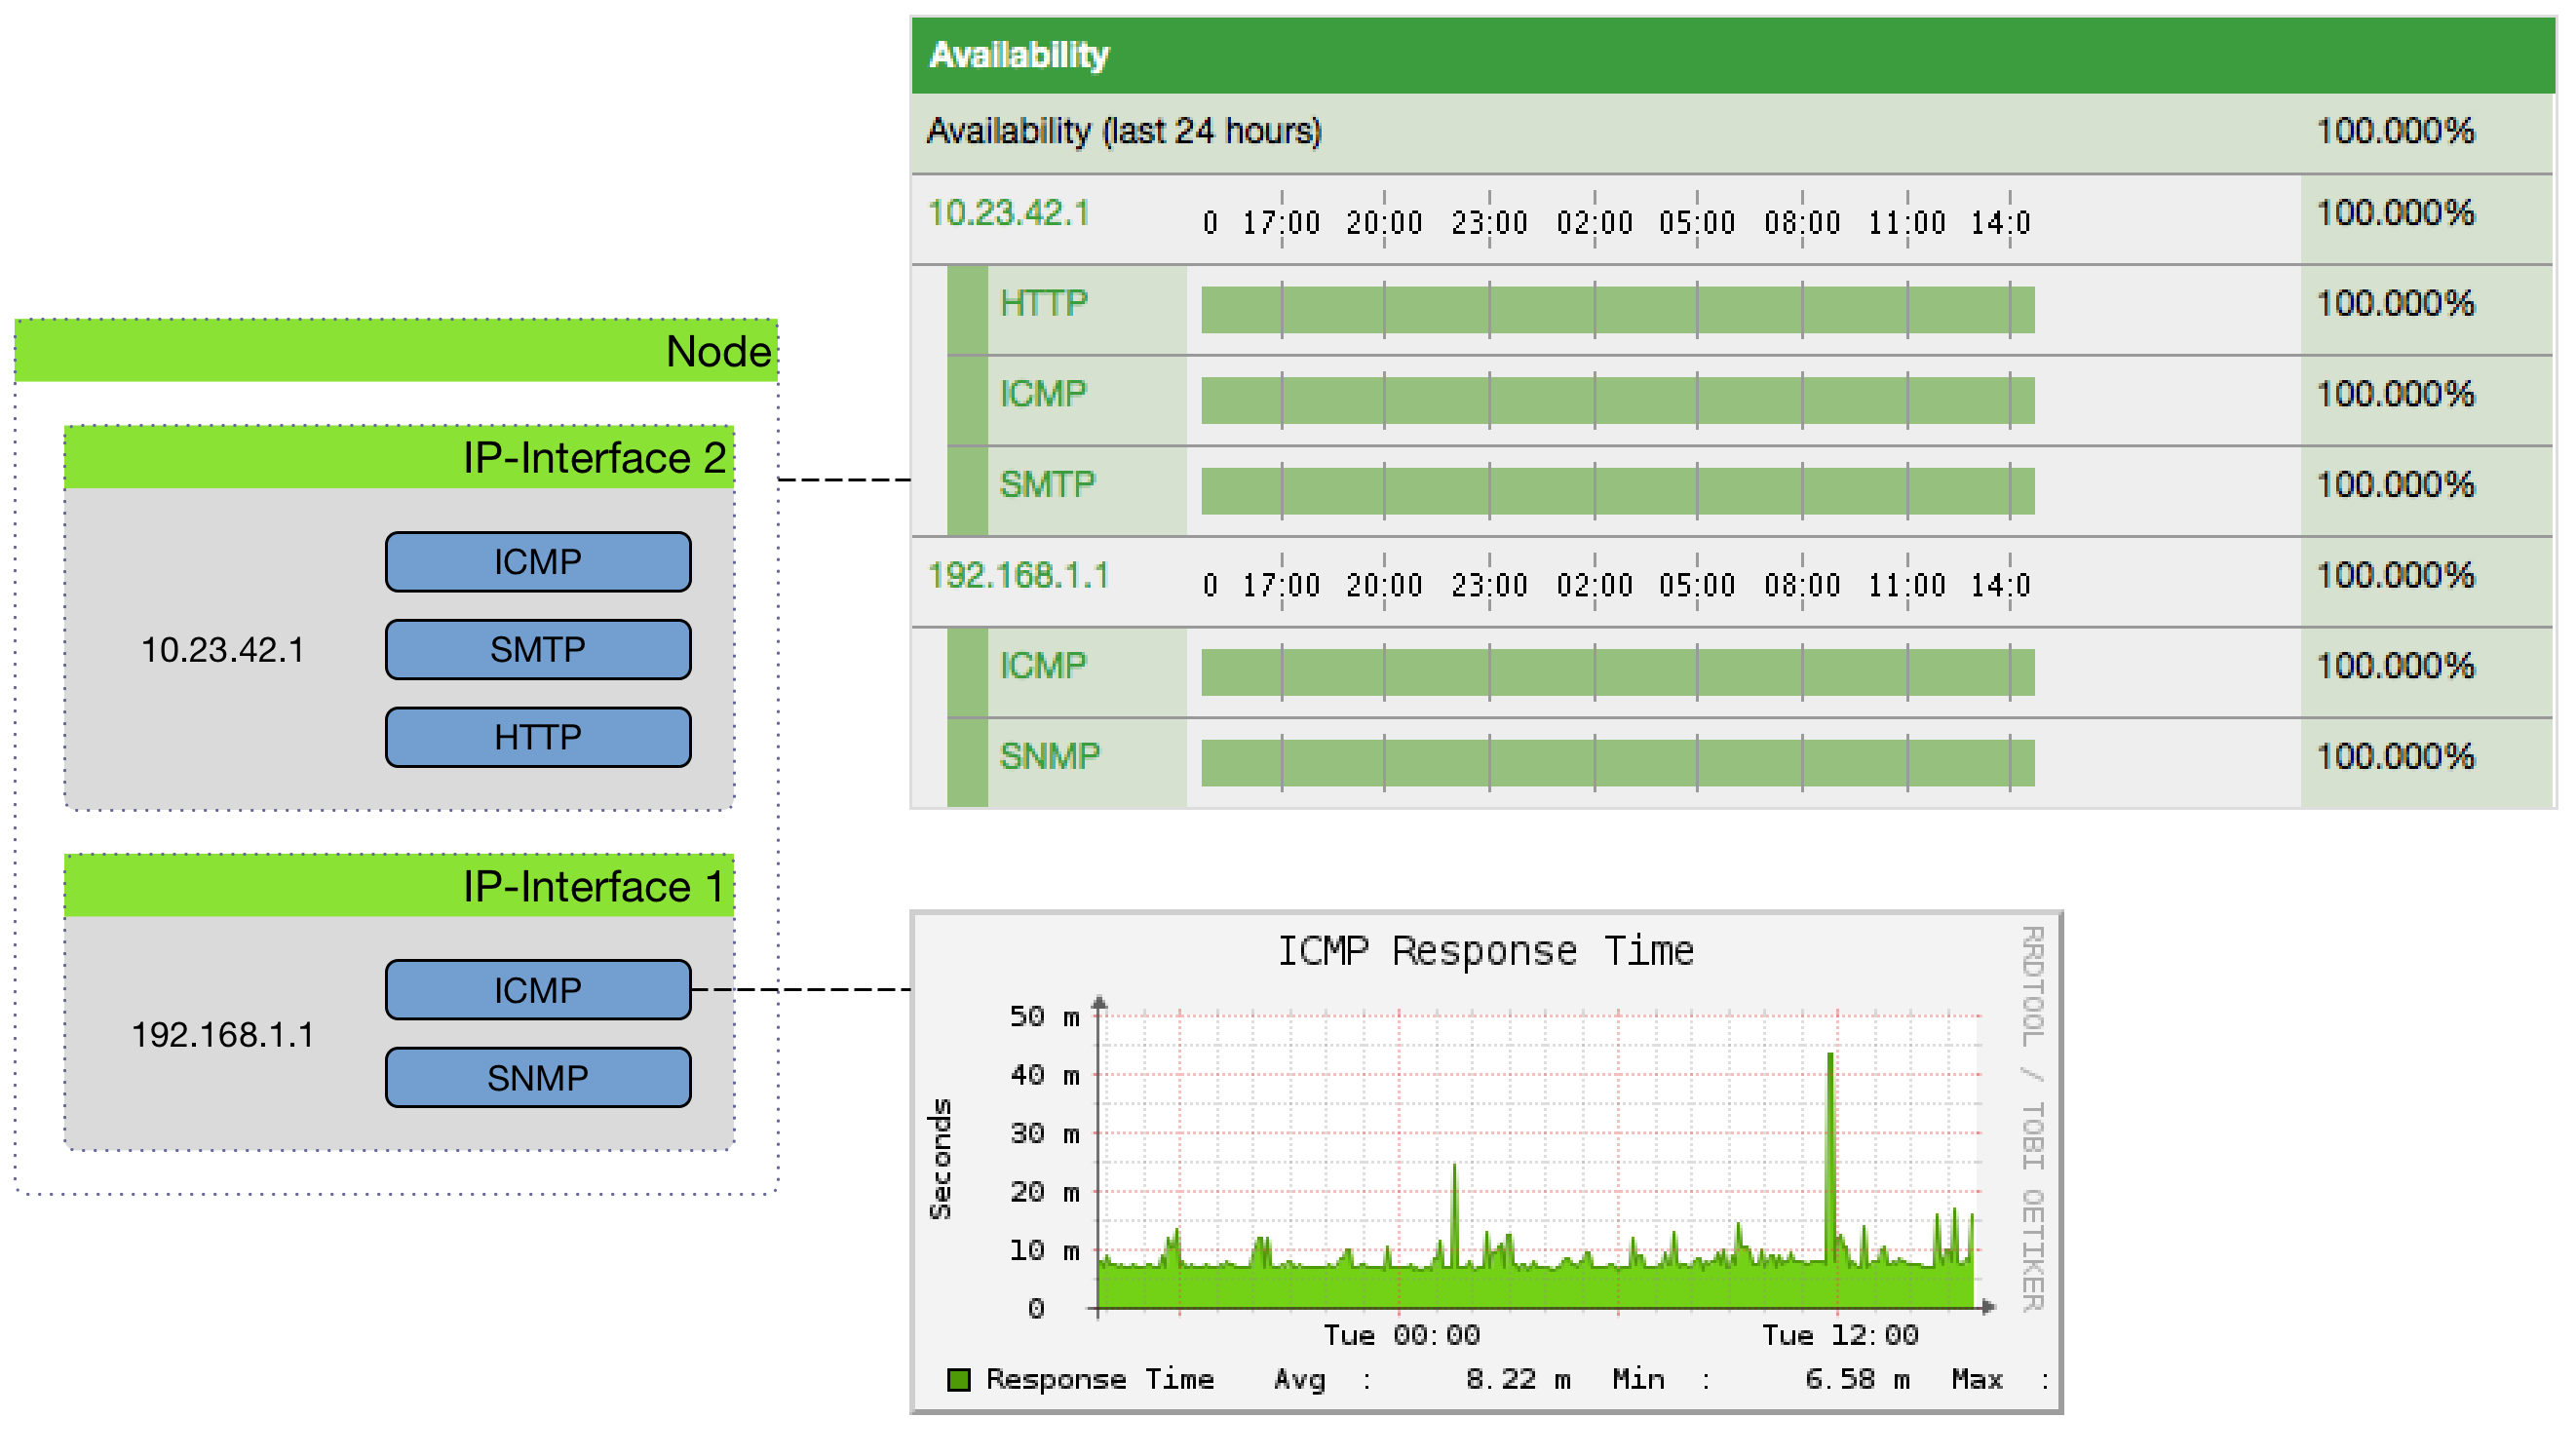
This information is based on service monitors which are stored and run by pollerd. A service can have any arbitrary name, and is associated with a service monitor; for example, two services can be defined with the names "HTTP" and "HTTP-8080". Both are associated with the HTTP Service Monitor, but each uses a different TCP port configuration parameter.
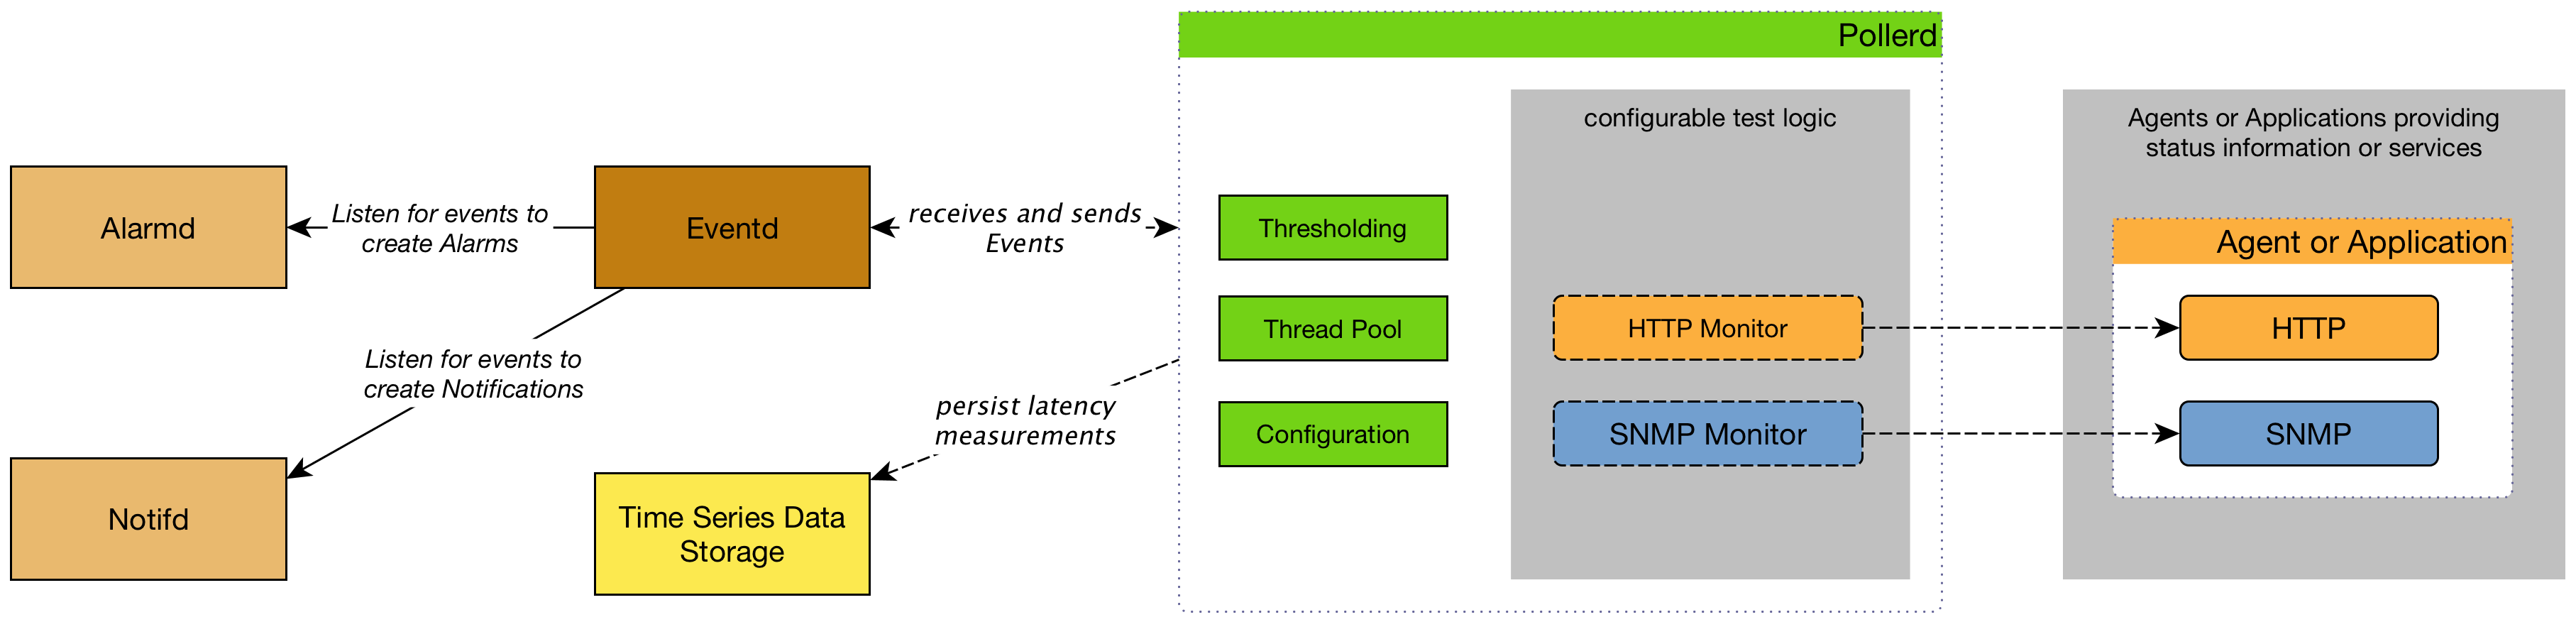
The following image shows how pollerd interacts with other Horizon components, and applications or agents to be monitored:
Availability is calculated over the last 24 hours, and is displayed in Surveillance Views, SLA Categories, and Node Detail pages. Response times are displayed as IP interface resource graphs on Node Detail pages. You can click a service’s name on any Node Detail page to see the service monitor’s configuration parameters. The status of a service can be up or down.
| The Service page also includes timestamps that indicate the last time the service was polled and found to to be up (last good) or down (last fail). These fields help to validate that pollerd is polling the services as expected. |
When a service monitor detects an outage, pollerd sends an event that is used to create an alarm. You can also use events to generate notifications for on-call network or server administrators. Pollerd can generate the following events in Horizon:
| Event Name | Description |
|---|---|
uei.opennms.org/nodes/nodeLostService |
Critical services are still up; just this service is lost. |
uei.opennms.org/nodes/nodeRegainedService |
Service came back up. |
uei.opennms.org/nodes/interfaceDown |
Critical service on an IP interface is down, or all services are down. |
uei.opennms.org/nodes/interfaceUp |
Critical service on that interface came back up. |
uei.opennms.org/nodes/nodeDown |
All critical services on all IP interfaces are down from node. The whole host is unreachable over the network. |
uei.opennms.org/nodes/nodeUp |
Some critical services came back online. |
The behavior to generate interfaceDown and nodeDown events is described in the critical services section.
| This assumes that node-outage processing is enabled. |