Business Service Topology
Business services can depend on each other. Together, they build a business service hierarchy. You can visualize the hierarchy using the Horizon topology map.
Operational status
The operational status of a business service is calculated by rolling up alarms from all subordinate services and edges.
A reduction key is used to define the class of alarms; this is represented as an edge of an associated business service.
The operational status provides more granularity than just "Up" or "Down" by associating severities to services (for example, Normal, Warning).
Based on the hierarchy, a service’s operational status is calculated using map and reduce functions. A map function influences which severity is used as an input to the business service. A reduce function consolidates severities from all edges of a business service and uses them as inputs; they are then reduced to a single severity, which becomes the service’s operational status.
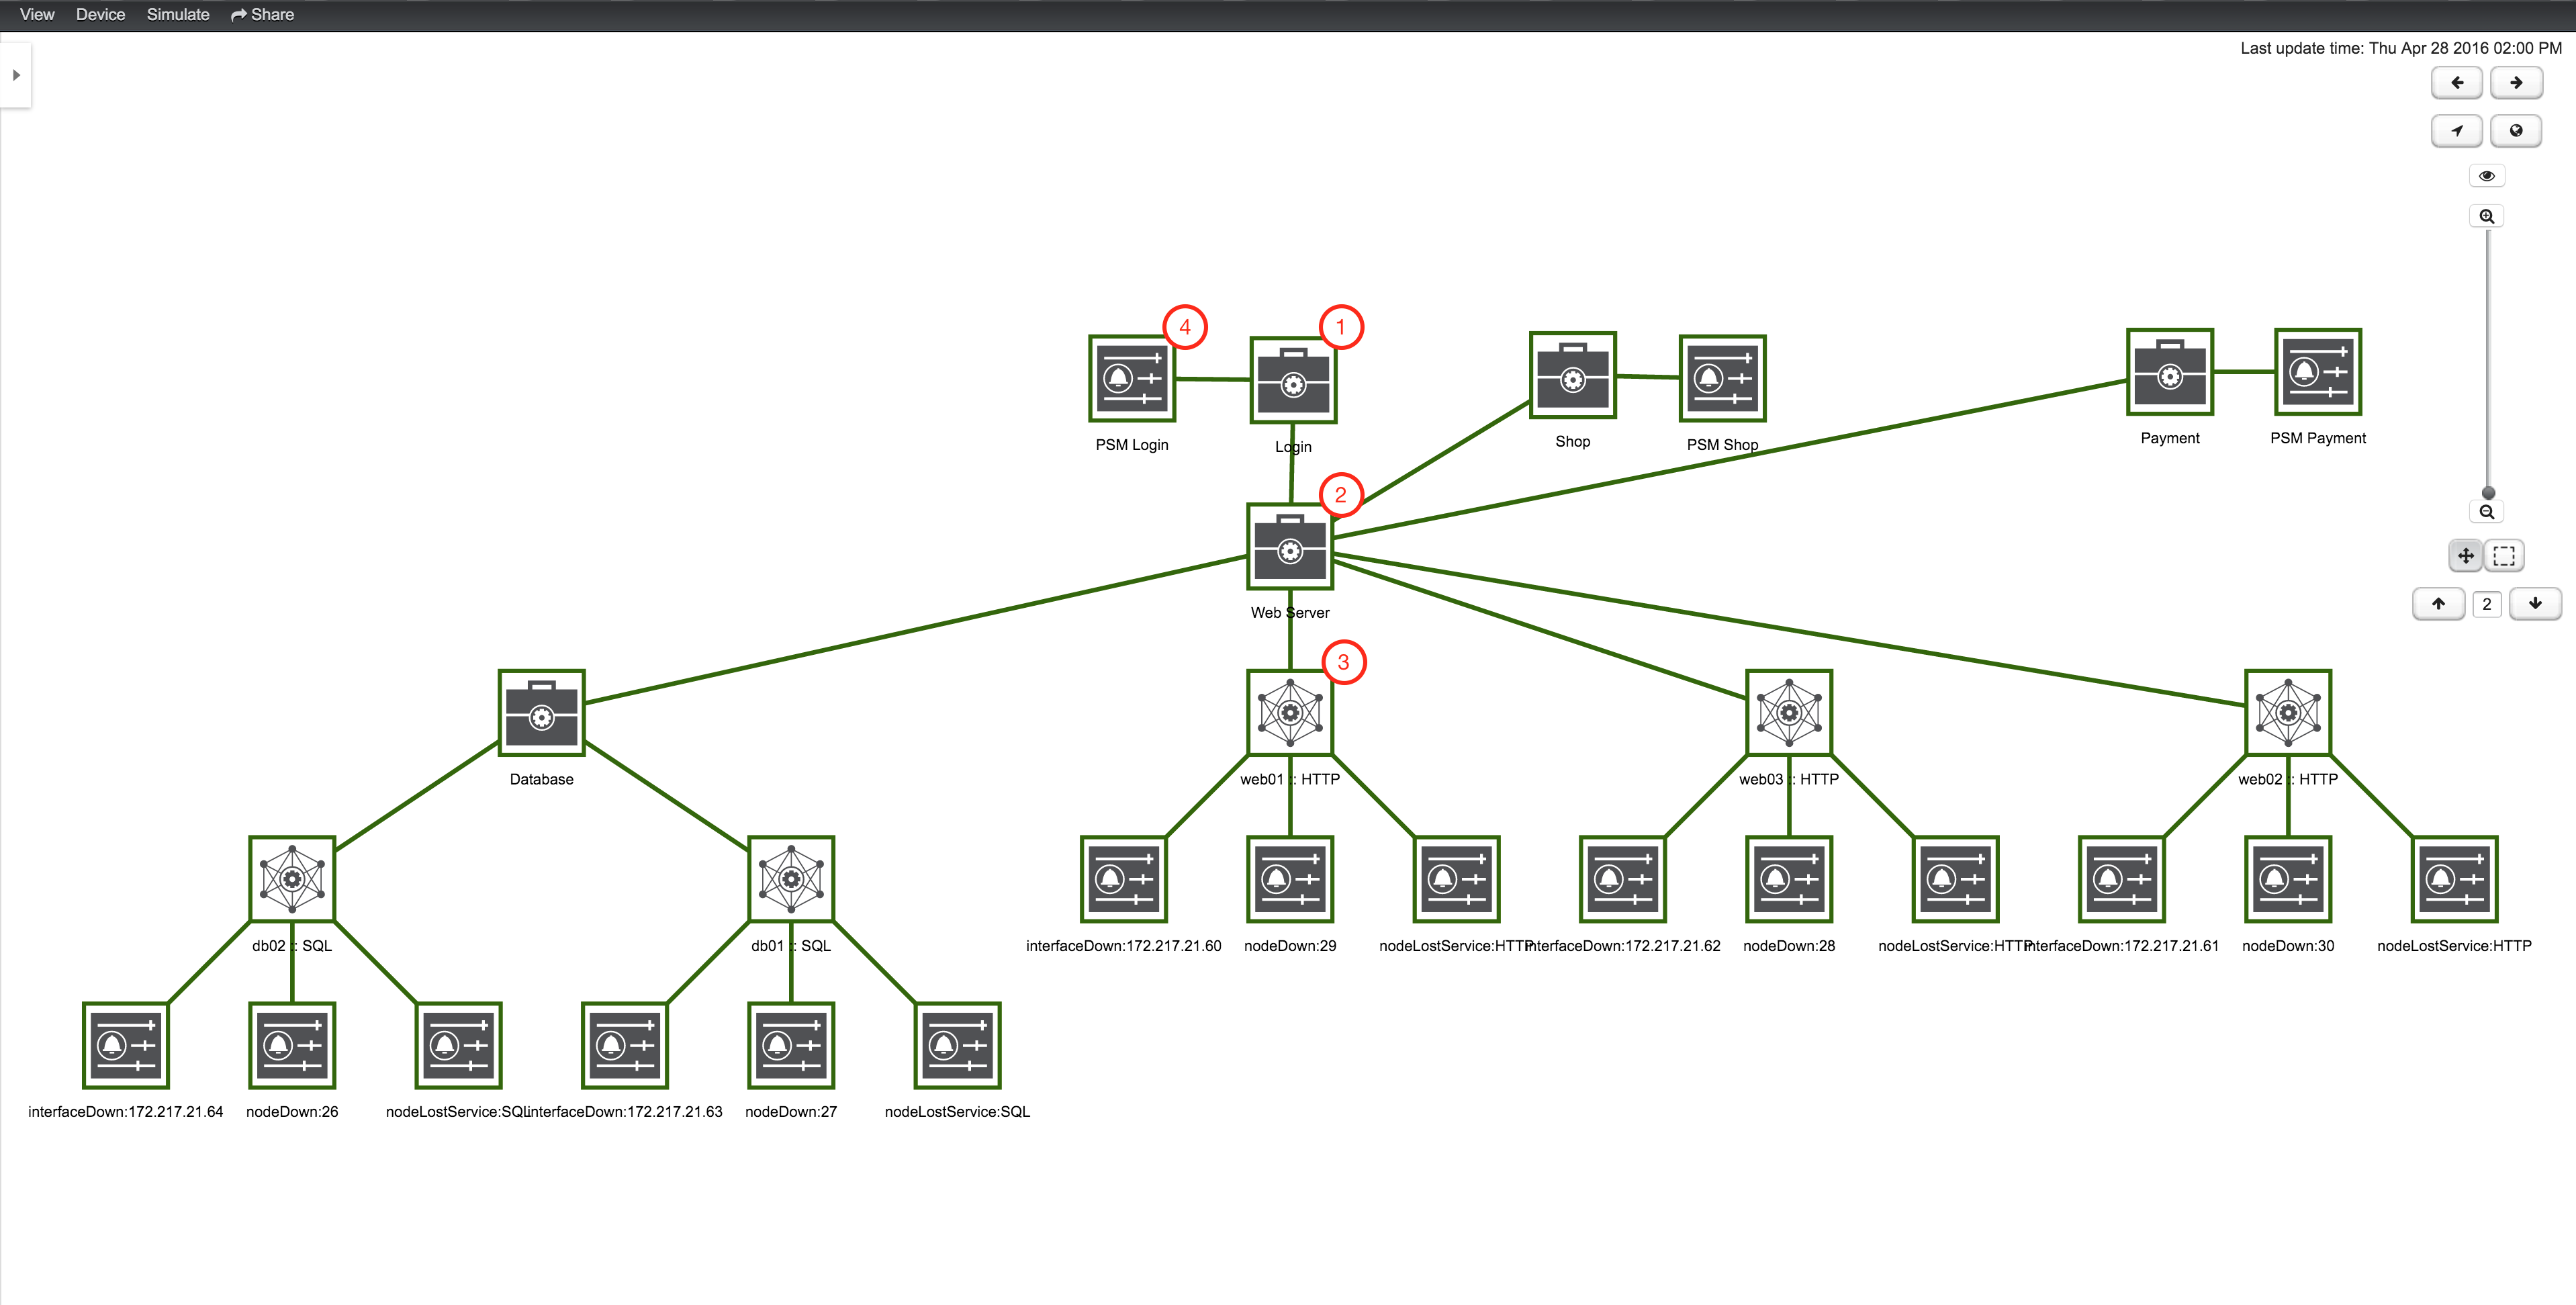
Topology Map
The Topology Map lets you traverse business service hierarchies using the semantic zoom level. The semantic zoom level defines how many neighbors are shown related to the elements that are in focus.
-
A top-level business service that depends on other business services, monitored services, and alarms. This service is referenced by the reduction key.
-
A subordinate business service and the operational status are used as inputs for the top-level business service.
-
The IP edge service that is used as an input, with automatically generated reduction keys for node down, interface down, and node lost service events.
-
Reduction key edge that is used as an input for the top-level business service, which references only a node lost service of a page sequence monitor for the user login.
To add or remove a business service or edge from focus, select it and click Add to Focus or Remove From Focus. To focus on a specific business service or edge, select it and click Set as Focal Point. The eye symbol highlights all elements in the topology map that are set to focus.
Simulation mode
You can use simulation mode to visualize if the configured business service behavior works as expected; this lets you validate and tune your hierarchy until it achieves the desired status propagation. To do so, manually set an alarm status at the edge of an element. The element’s operational status is calculated using the given map and reduce functions.
Follow these steps to enter simulation mode:
-
Click Topology Map in the side menu.
-
Click View and select Business Service View.
-
Click Simulate and select Simulation Mode to enable the feature.
-
Select Inherit State to use the severities and operational status from your monitoring environment in simulation mode.
-
Select Reset State to set all states to Normal for simulation.
-
Change icons
You can customize the icons for each element in the Business Service view.
To do so, select an element and choose Change Icon in the context menu.
To add custom .svg files, follow the instructions in Add new icons.