Trend
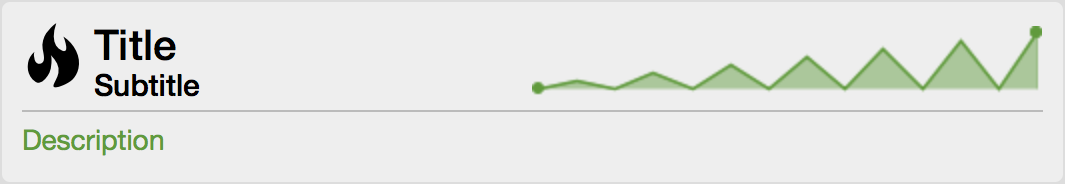
The Trend feature visualizes small, inline charts of database-related statistics (nodes experiencing outages, unacknowledged alarms, and so on).
Click in the side menu to view them.
You can define and configure trend charts in ${OPENNMS_HOME}/etc/trend-configuration.xml.
You can set trend charts to be displayed on the Horizon home page.
To do this, modify the org.opennms.web.console.centerUrl parameter to include /trend/trend-box.htm.
The following code defines a trend chart that displays nodes that are experiencing ongoing outages:
<trend-definition name="nodes">
    <title>Nodes</title> (1)
    <subtitle>w/ Outages</subtitle> (2)
    <visible>true</visible> (3)
    <icon>fa-fire</icon> (4)
    <trend-attributes> (5)
        <trend-attribute key="sparkWidth" value="100%"/>
        <trend-attribute key="sparkHeight" value="35"/>
        <trend-attribute key="sparkChartRangeMin" value="0"/>
        <trend-attribute key="sparkLineColor" value="white"/>
        <trend-attribute key="sparkLineWidth" value="1.5"/>
        <trend-attribute key="sparkFillColor" value="#88BB55"/>
        <trend-attribute key="sparkSpotColor" value="white"/>
        <trend-attribute key="sparkMinSpotColor" value="white"/>
        <trend-attribute key="sparkMaxSpotColor" value="white"/>
        <trend-attribute key="sparkSpotRadius" value="3"/>
        <trend-attribute key="sparkHighlightSpotColor" value="white"/>
        <trend-attribute key="sparkHighlightLineColor" value="white"/>
    </trend-attributes>
    <descriptionLink>outage/list.htm?outtype=current</descriptionLink> (6)
    <description>${intValue[23]} NODES WITH OUTAGE(S)</description> (7)
    <query> (8)
        <![CDATA[
            select (
                select
                    count(distinct nodeid)
                from
                    outages o, events e
                where
                    e.eventid = o.svclosteventid
                    and iflostservice < E
                    and (ifregainedservice is null
                        or ifregainedservice > E)
            ) from (
                select
                    now() - interval '1 hour' * (O + 1) AS S,
                    now() - interval '1 hour' * O as E
                from
                    generateseries(0, 23) as O
            ) I order by S;
        ]]>
    </query>
</trend-definition>| 1 | The title of the trend chart. See below for supported variable substitutions. | ||
| 2 | Subtitle of the trend chart. See below for supported variable substitutions. | ||
| 3 | The visible flag. This defines whether the chart is visible by default. | ||
| 4 | The icon for the chart. See Icons for options. | ||
| 5 | Attributes defining the inline chart. See jQuery Sparklines for options. | ||
| 6 | The description link. | ||
| 7 | The description text. See below for supported variable substitutions. | ||
| 8 | The SQL statement that queries the chart’s values.
|
You can use individual or aggregated values in the title, subtitle, and description fields. The following table describes available variable substitutions:
| Name | Description |
|---|---|
Integer variables |
|
${intmax} |
Integer maximum value |
${intmin} |
Integer minimum value |
${intavg} |
Integer average value |
${intsum} |
Integer sum of values |
${intValue[]} |
An array of integer result values for the given SQL query. |
${intValueChange[]} |
An array of integer value changes for the given SQL query. |
${intlastvalue} |
The last integer value |
${intlastvaluechange} |
The last integer value change. |
Double variables |
|
${doublemax} |
Double maximum value |
${doublemin} |
Double minimum value |
${doubleavg} |
Double average value |
${doublesum} |
Double sum of values |
{doubleValue[]} |
An array of double result values for the given SQL query. |
${doubleValueChange[]} |
An array of double value changes for the given SQL query. |
${doublelastvalue} |
The last double value |
${doublelastvaluechange} |
The last double value change. |
You can also display a single graph in your JSP files by including /trend/single-trend-box.jsp and specifying the name parameter.
example<jsp:include page="/trend/single-trend-box.jsp" flush="false">
<jsp:param name="name" value="example"/>
</jsp:include>