Surveillance View
The surveillance view displays an overview of your monitored network’s status, and serves as the foundation of the Horizon dashboard. You can filter and customize the data displayed as desired.
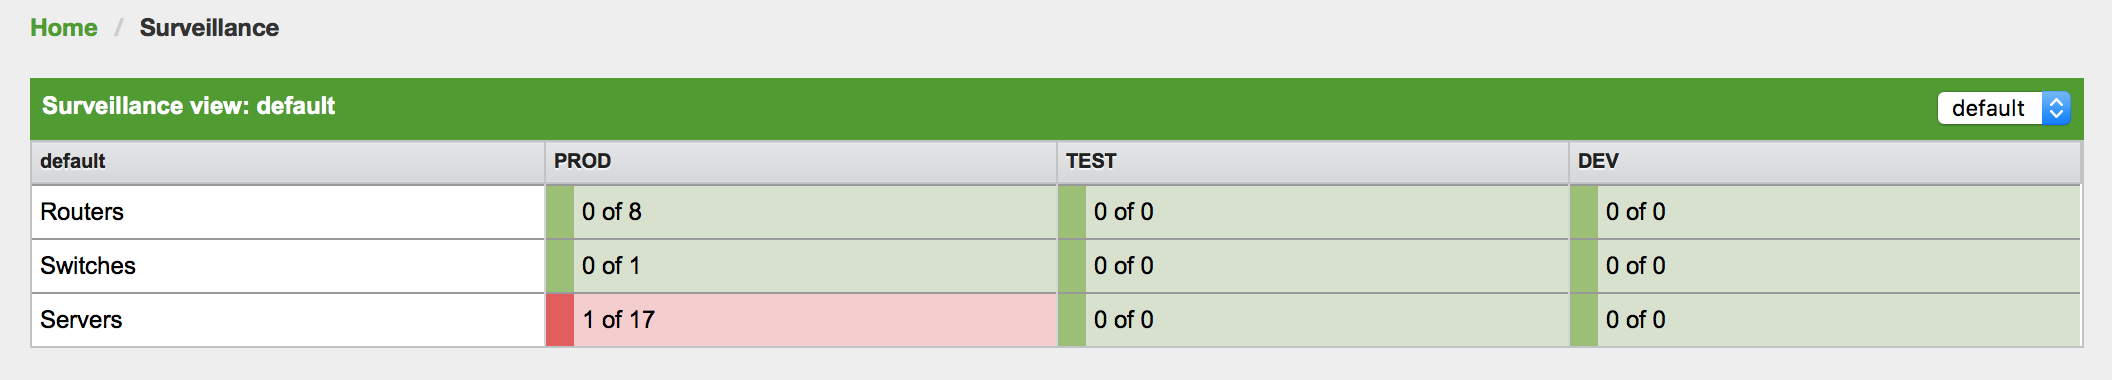
The surveillance view uses the following visual status indicators:
-
Green: No services down.
-
Yellow: One service down.
-
Red: More than one service down.
Default configuration
Surveillance views are defined in ${OPENNMS_HOME}/etc/surveillance-views.xml.
Horizon re-evaluates surveillance-views.xml every time the Surveillance View page is loaded.
Changes to the file do not require you to restart Horizon.
|
<?xml version="1.0" encoding="UTF-8"?>
<surveillance-view-configuration
  xmlns:this="http://www.opennms.org/xsd/config/surveillance-views"
  xmlns:xsi="http://www.w3.org/2001/XMLSchema-instance"
  xsi:schemaLocation="http://www.opennms.org/xsd/config/surveillance-views http://www.opennms.org/xsd/config/surveillance-views.xsd"
  default-view="default" >
  <views >
    <view name="default" refresh-seconds="300" >
      <rows>
        <row-def label="Routers" >
          <category name="Routers"/>
        </row-def>
        <row-def label="Switches" >
          <category name="Switches" />
        </row-def>
        <row-def label="Servers" >
          <category name="Servers" />
        </row-def>
      </rows>
      <columns>
        <column-def label="PROD" >
          <category name="Production" />
        </column-def>
        <column-def label="TEST" >
          <category name="Test" />
        </column-def>
        <column-def label="DEV" >
          <category name="Development" />
        </column-def>
      </columns>
    </view>
  </views>
</surveillance-view-configuration>
The old report-category attribute is deprecated and is no longer supported.
|
Matrix display
The matrix display allows for a significantly higher aggregation of data than a simple list. Using categories, you can define a matrix that lets you aggregate monitoring data.
Imagine that you have 10 servers with 10 internet connections, and 5 PCs with DSL lines. They may be categorized as follows:
| Servers | Internet Connections | |
|---|---|---|
Super Important |
1 of 10 |
0 of 10 |
Slightly Important |
0 of 10 |
0 of 10 |
Vanity |
4 of 10 |
0 of 10 |
In this way, the surveillance view can provide a quick idea of where trouble might be occurring in your monitored network.
Custom configuration
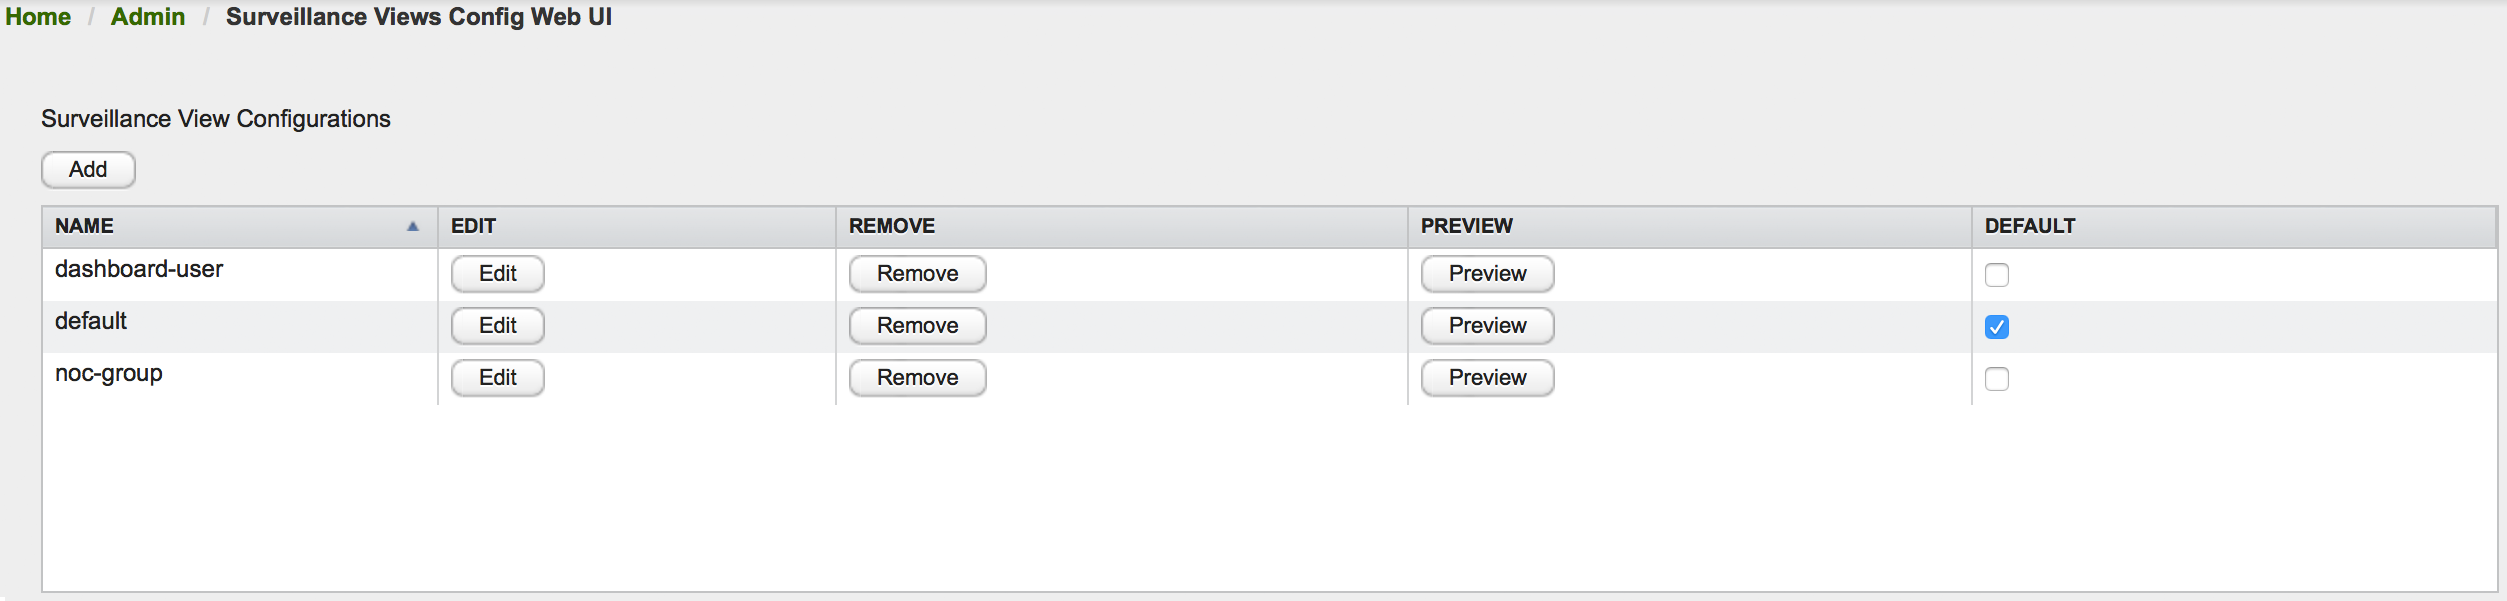
You can use the surveillance view configuration editor to modify a surveillance view:
-
Click in the side menu, then under Additional Tools, click Surveillance Views Configuration.
The page displays an overview of configured surveillance views and lets you edit, remove, and preview them. You can also designate a default surveillance view by selecting Default beside its name.
When you configure a surveillance view, you must define its title and the amount of time (in seconds) between refreshes. You can also add and delete columns and rows, and reorder them as desired by clicking the up arrow and down arrow symbols.
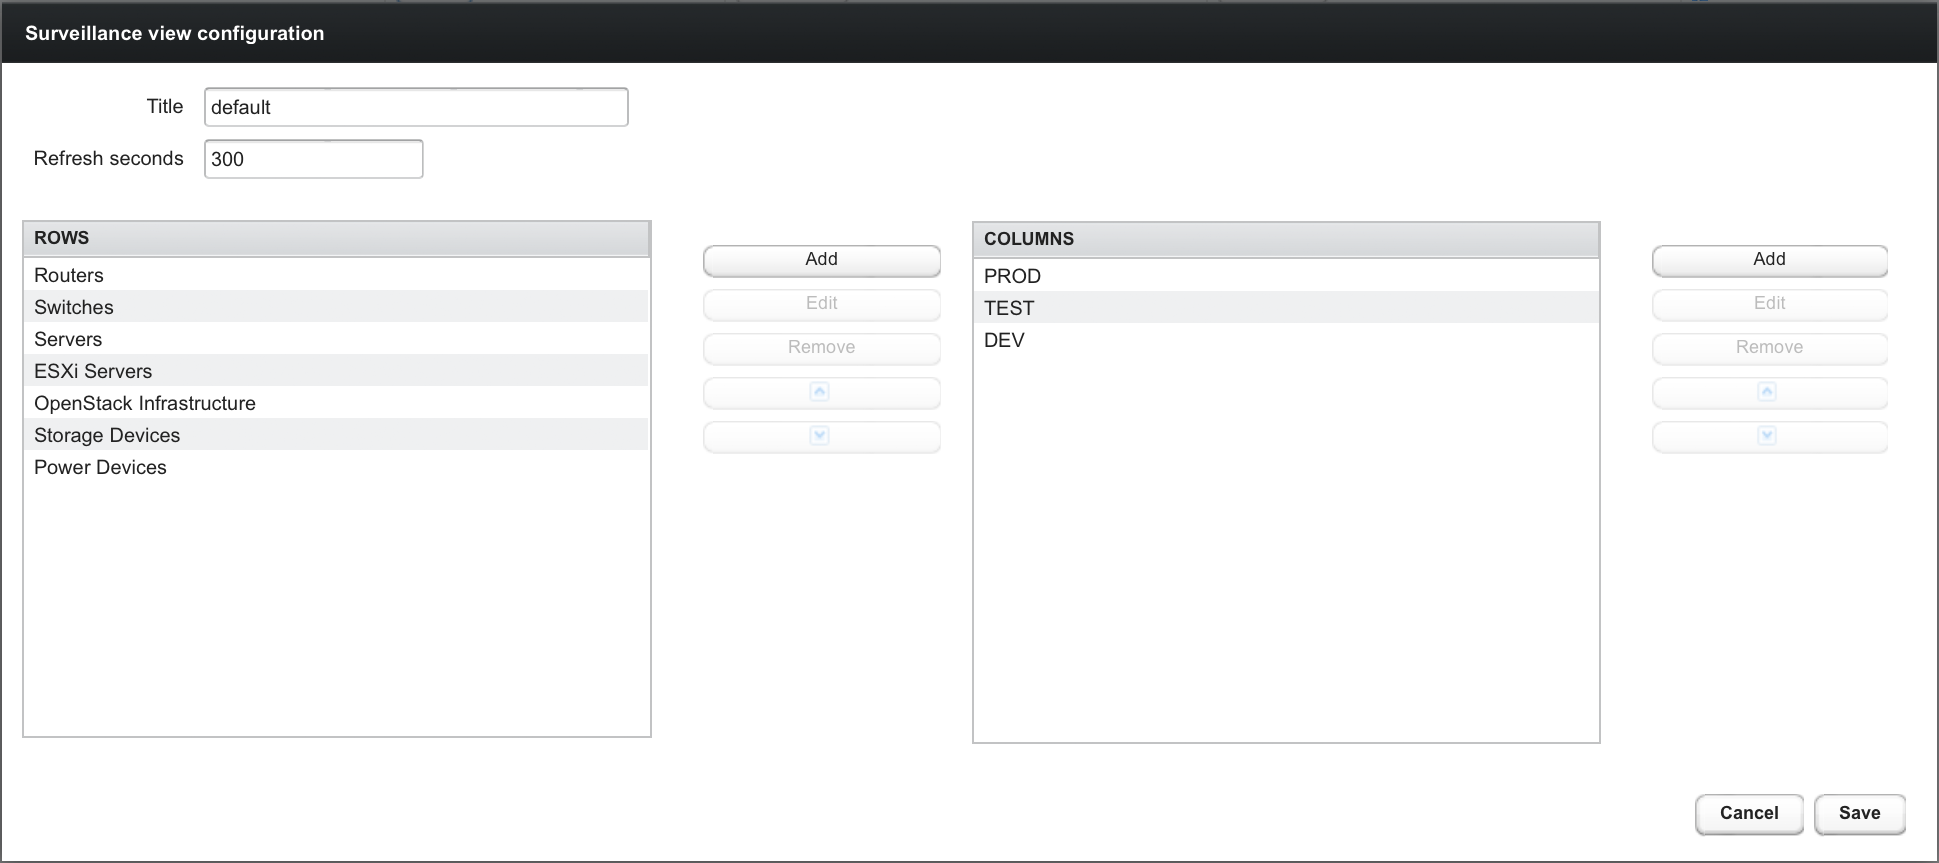
Editing row or column definitions requires you to choose a unique label and at least one Horizon category.
When you are finished, click Save to persist the configuration settings. To close the dialog without saving, click Cancel.
Categorize nodes
Follow the steps below to categorize a node in the surveillance view:
-
Click in the side menu.
-
Click Edit beside the Surveillance Category Memberships section title.
-
Select the check box at the bottom of the page to enable category membership controls.
Any changes made to a node that was provisioned through a requisition will be rolled back the next time the node is synchronized or manually rescanned. -
Edit the category memberships:
-
Select categories from the Available Categories list and click Add >> to add them to the node.
-
Select categories from the Categories on Node list and click Remove << to remove them from the node.
-
Your changes are automatically saved.
Create views for users and groups
You can create surveillance views for only specific users or users in specific groups.
For example, to create a view that only the user drv4doe can access, edit ${OPENNMS_HOME}/etc/surveillance-view.xml and add a definition for the user:
<view name="drv4doe" refresh-seconds="300" >
  <rows>
    <row-def label="Servers" >
      <category name="Servers"/>
    </row-def>
  </rows>
  <columns>
    <column-def label="PROD" >
      <category name="Production" />
    </column-def>
    <column-def label="TEST" >
      <category name="Test" />
    </column-def>
  </columns>
</view>
You can do the same for group names.
You should add the definition within the <views> tag, above the default view.
|
When the Surveillance View page loads, the first of the following criteria to be fulfilled determines the view it displays:
-
The surveillance view name is equal to the username.
-
The surveillance view name is equal to the user’s assigned group name.
-
The surveillance view name is equal to the
default-viewattribute as defined insurveillance-views.xml.