Default Classic Report
The default classic report is generated directly from the Horizon Java code. As such, it has no optional parameters to modify. Its report period spans the current month, up to the last full day before the day the report is generated (for example, a report generated on April 23 will cover April 1-22). All of the data is presented in tables.
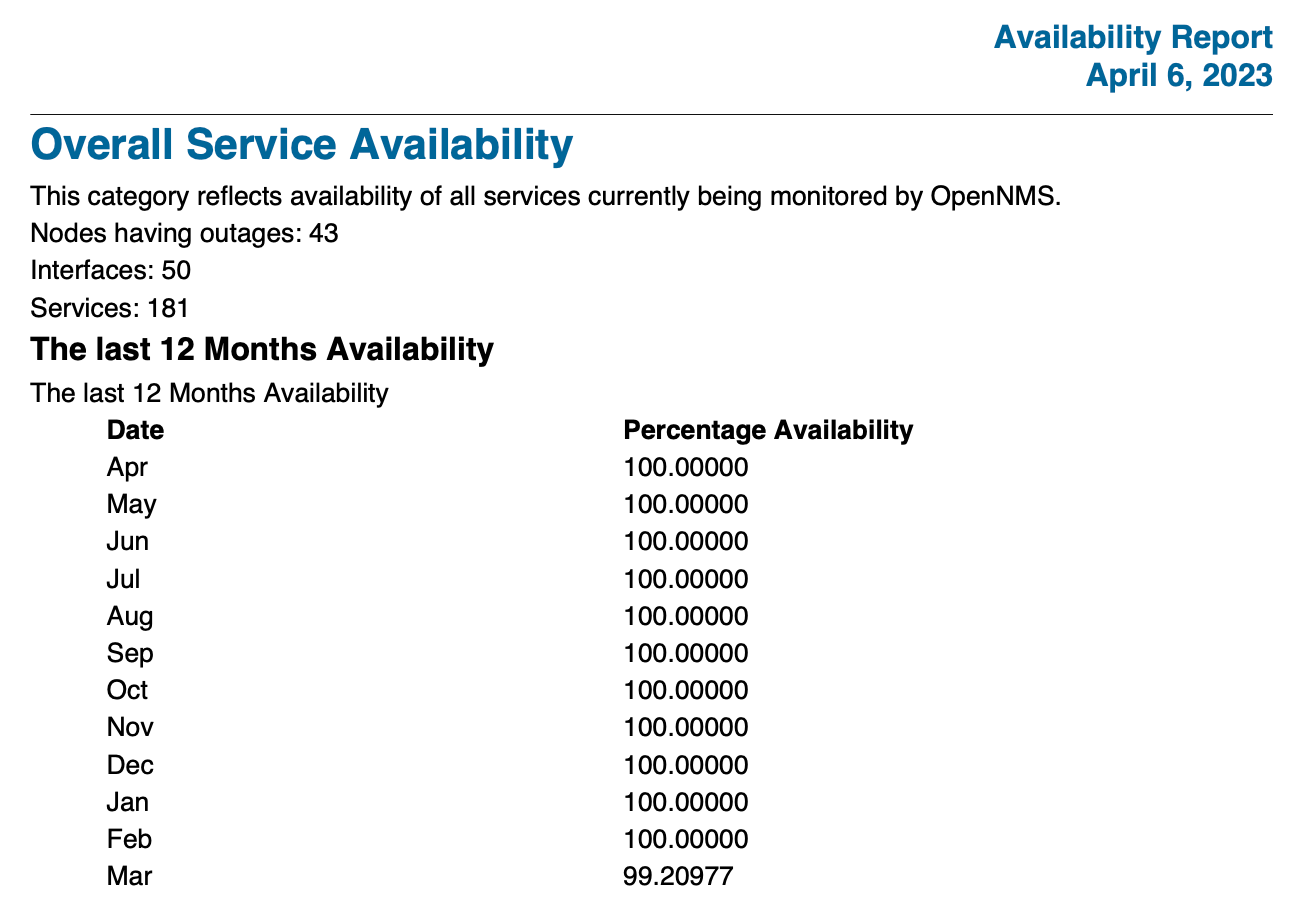
The first table contains monthly availability statistics for all services monitored by Horizon for the past year. It also lists the number of nodes that had outages, the number of interfaces, and the number of services:
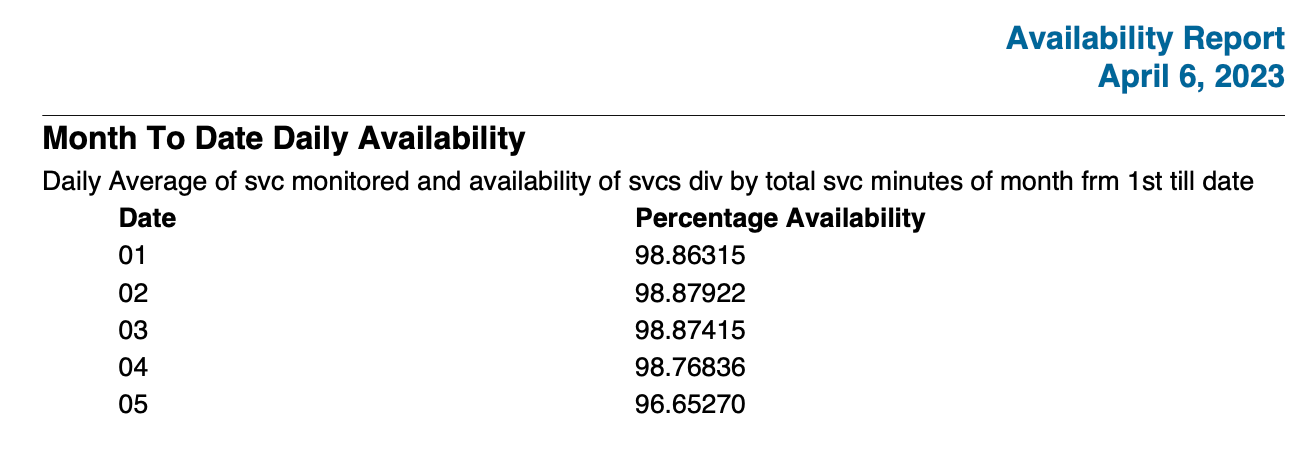
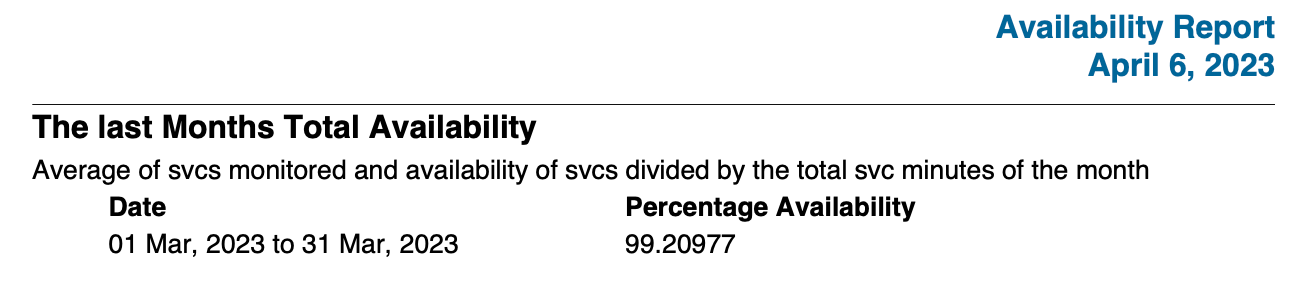
The next two tables list the daily average of services monitored, and the availability of services divided over the previous full month and the current month to date:
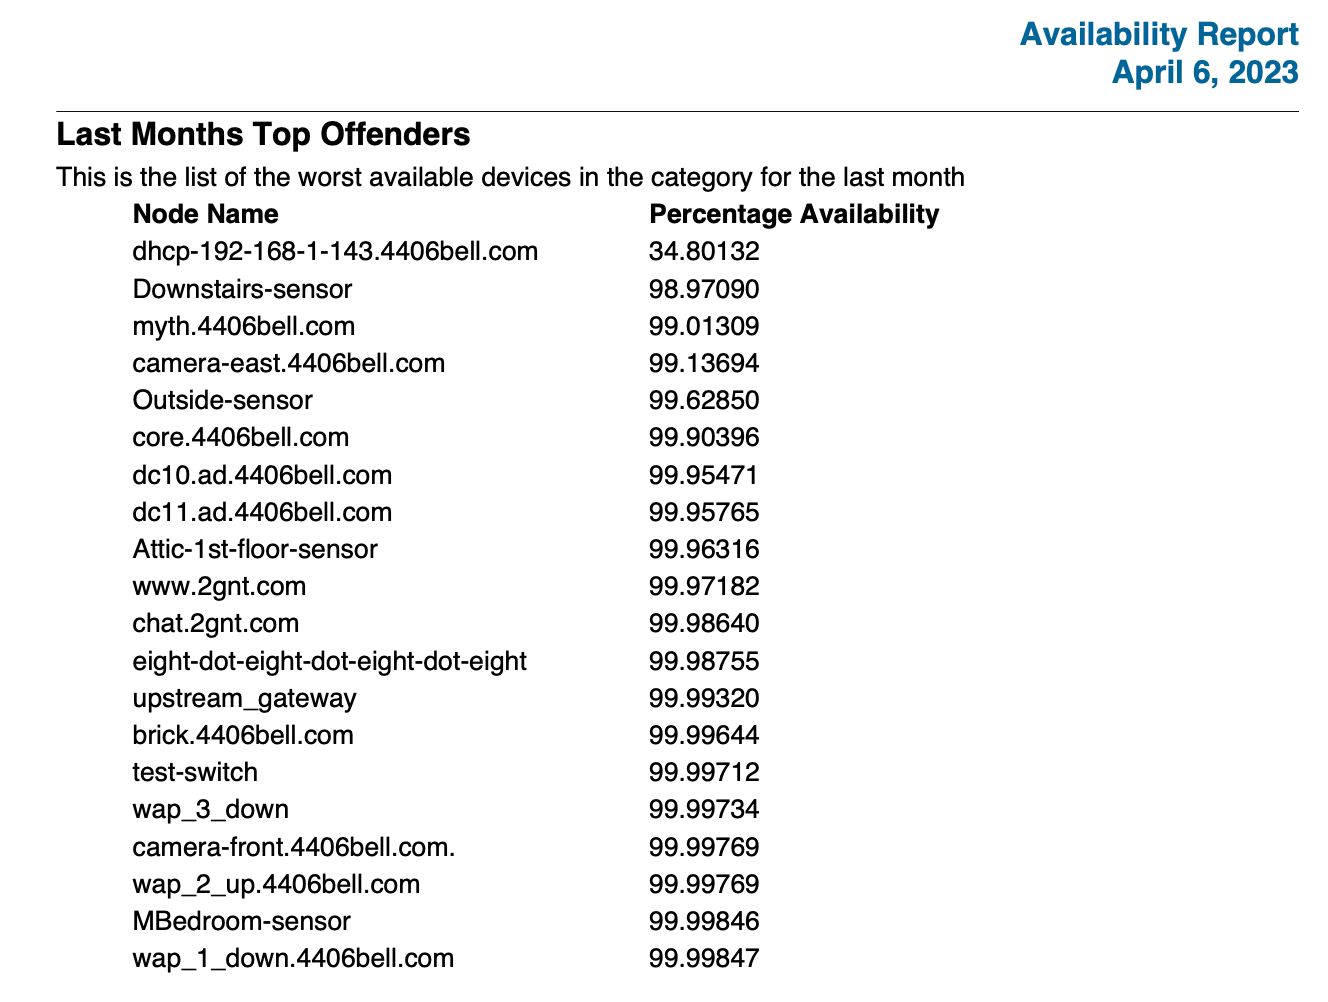
The next table lists the monitored devices with the worst availability rates during the previous month:
The next table lists daily availability over the past 30 days:
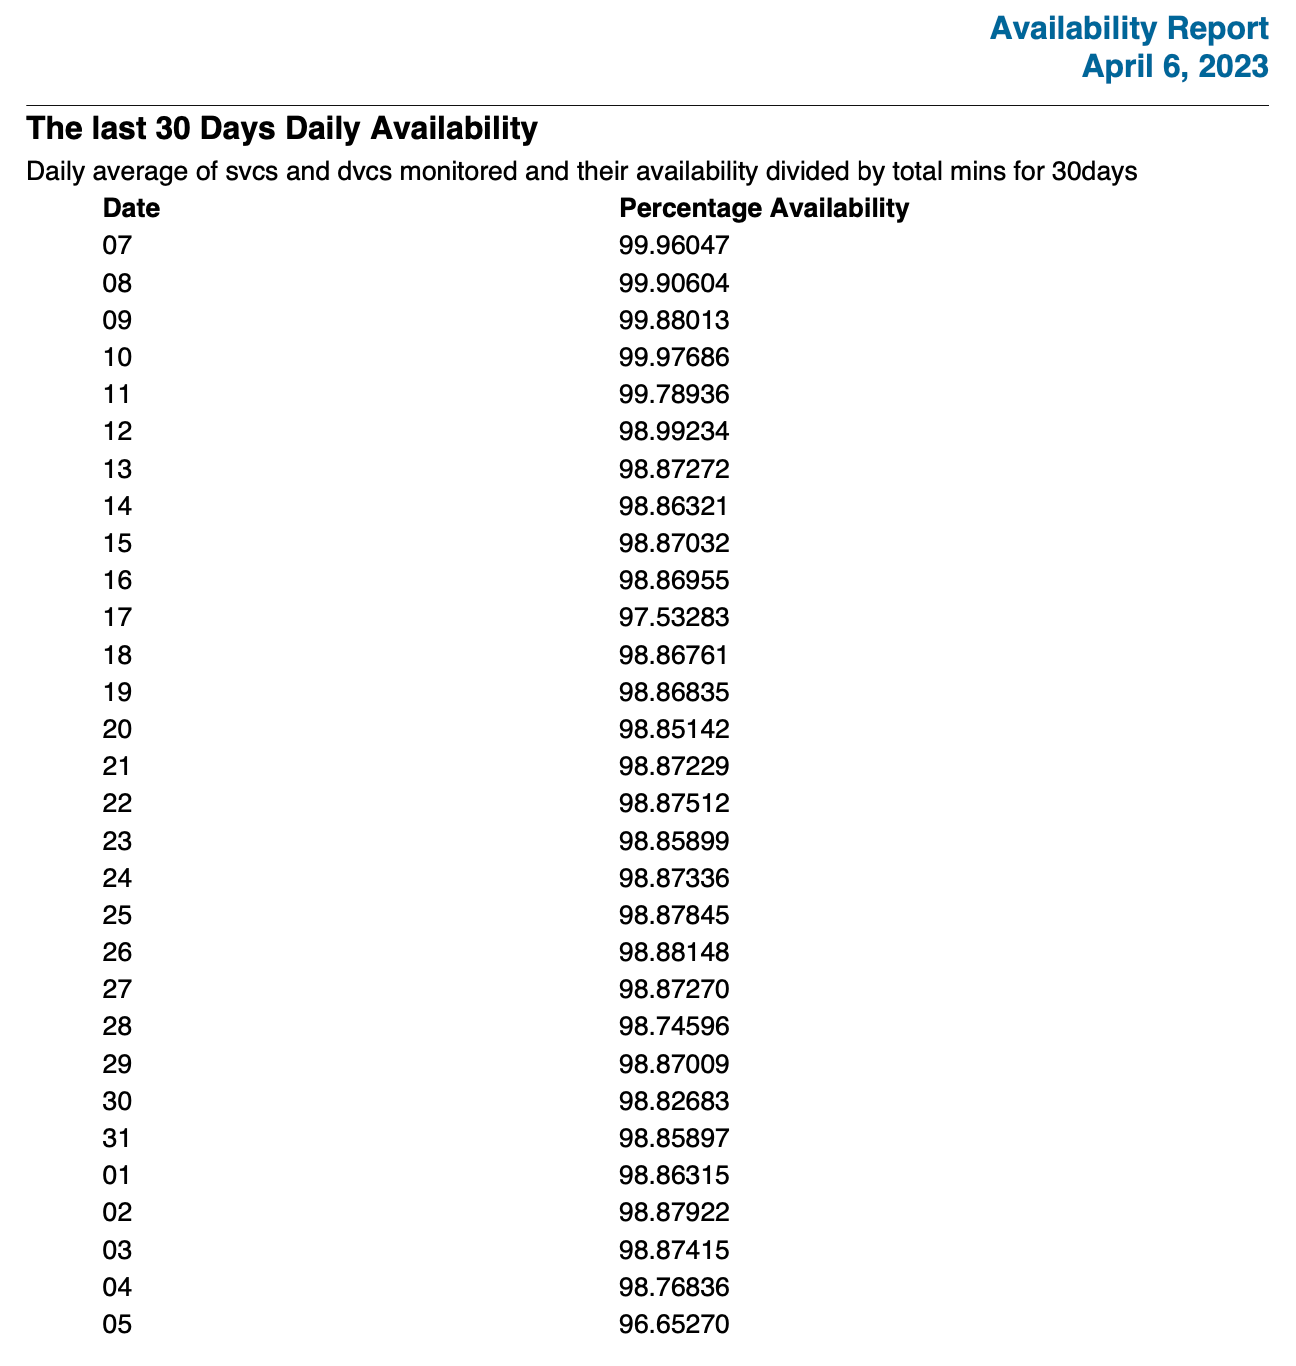
The average of these 30 data points is calculated and displayed in the next table.
The next two tables show the average availability for every monitored service on each device for the previous full month, and the current month to date:
The remaining tables show the top service outages for the previous month. Each entry lists the affected node, the duration of the outage, and the date and time when the outage occurred.