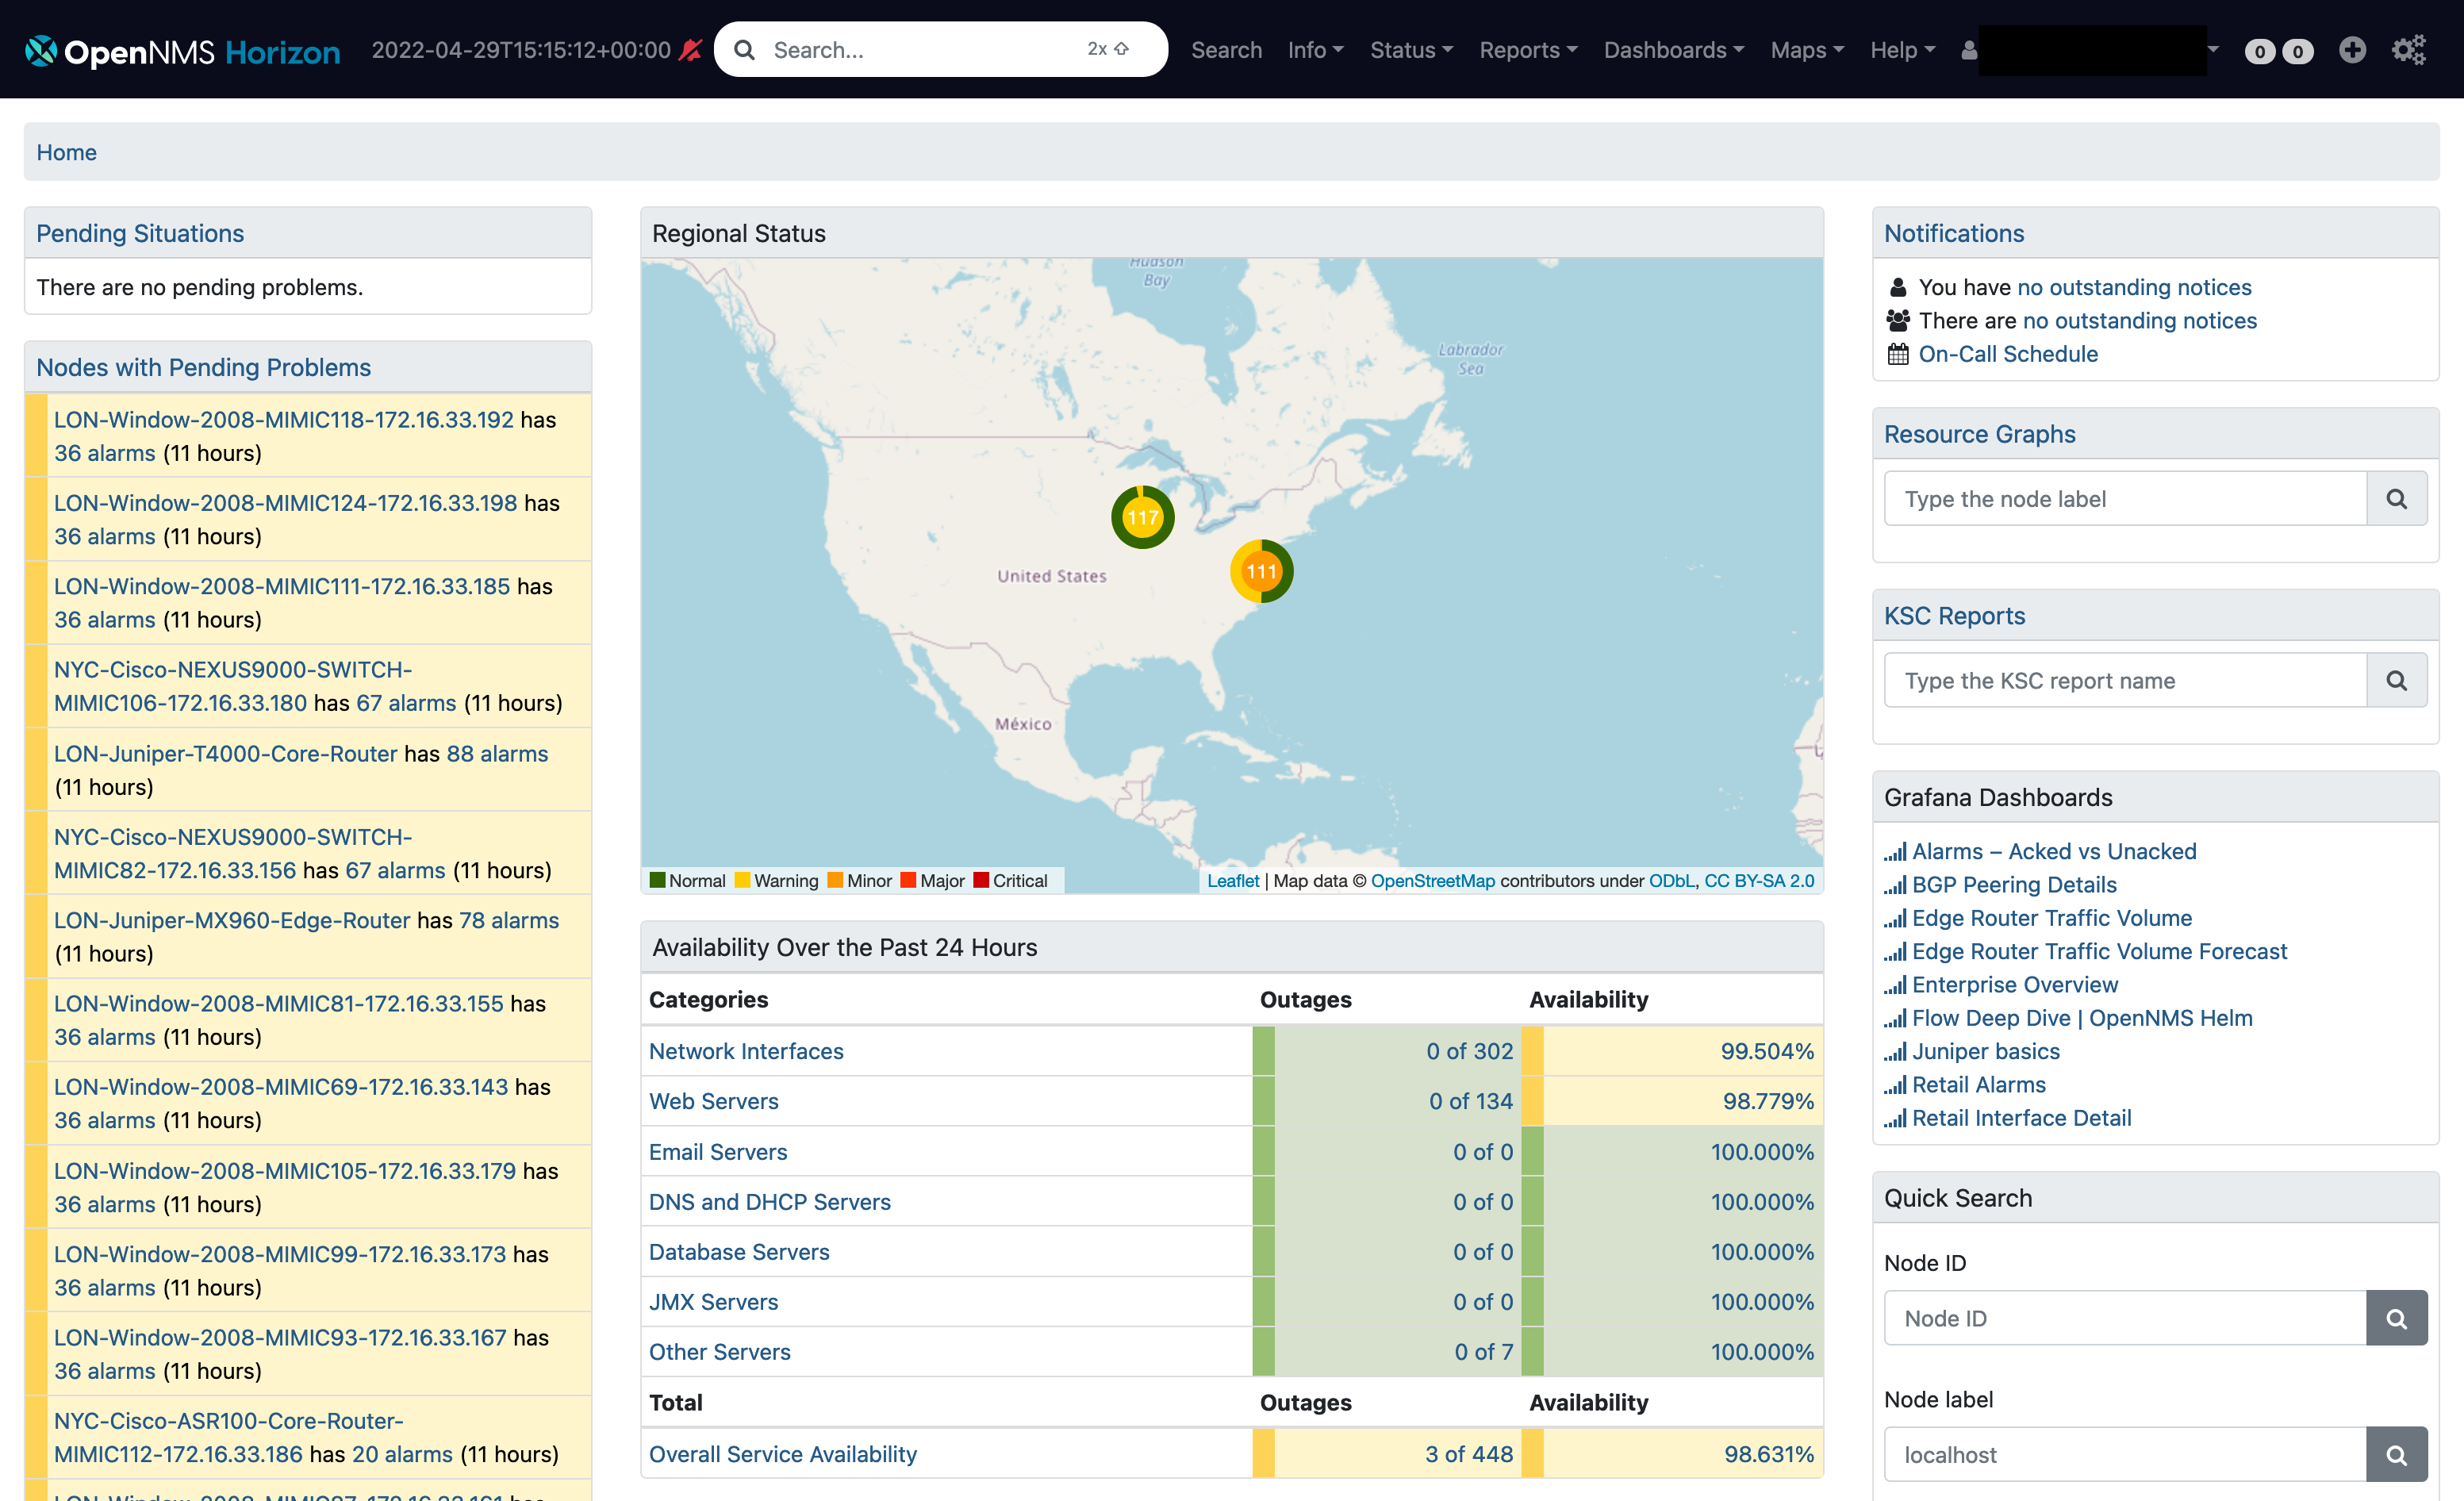
Grafana Dashboard Box
Meridian uses Grafana to generate visualizations, including those displayed in the Grafana Dashboard Box.
Filter dashboards
To filter for relevant dashboards, you can use a dashboard’s tag (defined by the org.opennms.grafanaBox.tag property) and make it accessible.
If no tag is provided, all Grafana dashboards are shown.
You can configure this feature by creating or editing ${OPENNMS_HOME}/etc/opennms.properties.d/grafana.properties and setting the configuration properties.
| Name | Description | Default Value |
|---|---|---|
Boolean property |
||
org.opennms.grafanaBox.show |
Determines whether a Grafana Dashboard Box showing the available dashboards is included on the home page. |
false |
Integer properties |
||
org.opennms.grafanaBox.port |
The port for the Grafana server’s REST API. |
3000 |
org.opennms.grafanaBox.connectionTimeout |
Connection timeout, in milliseconds, for fetching information from the Grafana server. |
500 |
org.opennms.grafanaBox.soTimeout |
Socket timeout, in milliseconds. |
500 |
org.opennms.grafanaBox.dashboardLimit |
The maximum number of entries to display.
Setting the value to |
0 |
org.opennms.grafanaBox.link.port |
The port used to build each dashboard URL. |
org.opennms.grafanaBox.port |
String properties |
||
org.opennms.grafanaBox.hostname |
The hostname of the Grafana server. You may need to use the IP address or fully qualified domain name, based on your DNS records. |
localhost |
org.opennms.grafanaBox.basePath |
The base path to Grafana. |
Empty |
org.opennms.grafanaBox.apiKey |
The Grafana API key. This key is needed for REST calls to work. Refer to the official Grafana HTTP documentation for details on generating an API key. |
Empty |
org.opennms.grafanaBox.tag |
A tag that specifies which dashboards to display in the Grafana Dashboard Box. The tag must be assigned to an existing dashboard for it to be included. When no tag is specified, all dashboards are displayed. |
Empty |
org.opennms.grafanaBox.protocol |
The protocol for the REST call. |
http |
org.opennms.grafanaBox.link.protocol |
The protocol used to build each dashboard URL. |
org.opennms.grafanaBox.protocol |
org.opennms.grafanaBox.link.hostname |
Hostname used to build each dashboard URL. |
org.opennms.grafanaBox.hostname |
org.opennms.grafanaBox.link.basePath |
The Grafana base path used to build each dashboard URL. |
org.opennms.grafanaBox.basePath |
If you have Grafana set up behind a reverse proxy, you may need to define the org.opennms.grafanaBox.link.* properties.
The link.* properties, if defined, are used to build the user-facing URLs, independent of other properties that are used for internal interaction with the Grafana REST API.
|