Database Reports
Reporting on data from your monitoring system is important for strategic and operational decisions. Database reports provide access to the Meridian JasperReports engine, and let you create and customize report templates. You can run reports on demand or on a predefined schedule.
| Originally, database reports created reports based only on data stored in the Meridian database. This is no longer mandatory; you can also use performance data. Theoretically, reports do not need to be Meridian-related. |
The Meridian Report Engine lets you create reports and supports distributed report repositories. This documentation does not cover those features; it describes only reports using the JasperReports engine and Grafana dashboards.
Overview
The Meridian Report Engine uses the JasperReport library to create reports in various formats.
Each report template must be saved as a *.jrxml file.
Every time a report runs, the Report Engine passes it a JDBC connection to the Meridian database.
| Only a JDBC connection to the Meridian database can be passed to the report. |
Supported Output Formats |
PDF, CSV |
JasperReport Version |
6.3.0 |
For more details on how JasperReports works, see the official Jaspersoft Studio documentation.
Report templates
Meridian includes the following sample report templates:
| Report Name | Category | Description |
|---|---|---|
Status |
Summary of outages and availability for a specified node tag, spanning a specified number of days. |
|
Status |
List of availability statistics for each node in a specified node tag, spanning a specified number of days. |
|
Status |
Network availability information across the previous month and the current month, to date, presented in a calendar format. Summary of devices with the most problems, and monitored services. This is not a JasperReport. |
|
Status |
Network availability information across the previous month and the current month, to date. Summary of devices with the most problems, and monitored services. This is not a JasperReport. |
|
Status |
Tables and charts showing different slices on the top 25 events over the past 30 days. |
|
Grafana |
Three variations of reports created from a specified Grafana dashboard. |
|
Status |
Availability summary of interfaces which have experienced outages, spanning a specified time range. |
|
Asset Management |
Summary of assets whose maintenance contracts are set to expire within a specified time range. |
|
Asset Management |
Summary of assets, sorted by device age, and then by contract status. It also shows how many contracts are set to expire within the next 12 months. |
|
Status |
Summary of node status over the past 24 hours. |
|
Status |
Summary of response times for nodes with a specified tag. |
|
Status |
Summary of response times, listed by node. |
|
Status |
Summary of serial interface utilization. |
|
Status |
Summary of SNMP interface status over a specified time range. |
|
Usage |
Summary of bytes transferred, listed by interface. |
|
Usage |
Average and peak traffic rates for nodes, listed by interface. |
Modify report templates
All default report templates are stored in ${OPENNMS_HOME}/etc/report-templates, and can be modified to suit your needs.
Any changes are applied the next time Meridian creates a report.
When a subreport is modified, Meridian detects the change based on the report’s lastModified parameter and recompiles it.
A compiled version of the report is represented by a .jasper file with the same name as the .jrxml file.
Subreports are located in ${OPENNMS_HOME}/etc/report-templates/subreports.
If you are not sure that your compiled subreports match the current templates, simply delete all .jasper files.
Meridian automatically recompiles the subreports as needed.
|
Add a custom report
To add a new report to your local Meridian repository, follow these steps:
-
Create a new entry in
${OPENNMS_HOME}/etc/database-reports.xml:<report id="MyReport" (1) display-name="My Report" (2) online="true" (3) report-service="jasperReportService" (4) description="This is an example description. It shows up in the web ui when creating an online report" (5) />1 A unique identifier. 2 The name of the report. This name is displayed in the web UI. 3 Defines if this report can run on demand; otherwise, only scheduling is possible. 4 The report service implementation to use. In most cases, this is jasperReportService.5 A description of the report. This description is displayed in the web UI. -
Create a new entry in
${OPENNMS_HOME}/etc/jasper-reports.xml:<report id="MyReport" (1) template="My-Report.jrxml" (2) engine="jdbc" (3) />1 The identifier defined in the previous step. It must exist in ${OPENNMS_HOME}/etc/database-reports.xml.2 The name of the template. The template must be located in ${OPENNMS_HOME}/etc/report-templates.3 The engine to use (either jdbcornull).
Jaspersoft Studio
We recommend that you use Jaspersoft Studio to develop new reports. You can download it via the official Jaspersoft website.
| We recommend that you use the same version of Jaspersoft Studio that the Meridian JasperReport library uses. Currently, Meridian uses version 6.3.0. |
Connect to Meridian database
You must create a database data adapter to run SQL queries against your Meridian database (see the official Jaspersoft Studio documentation).
Use Measurements Datasource and helpers
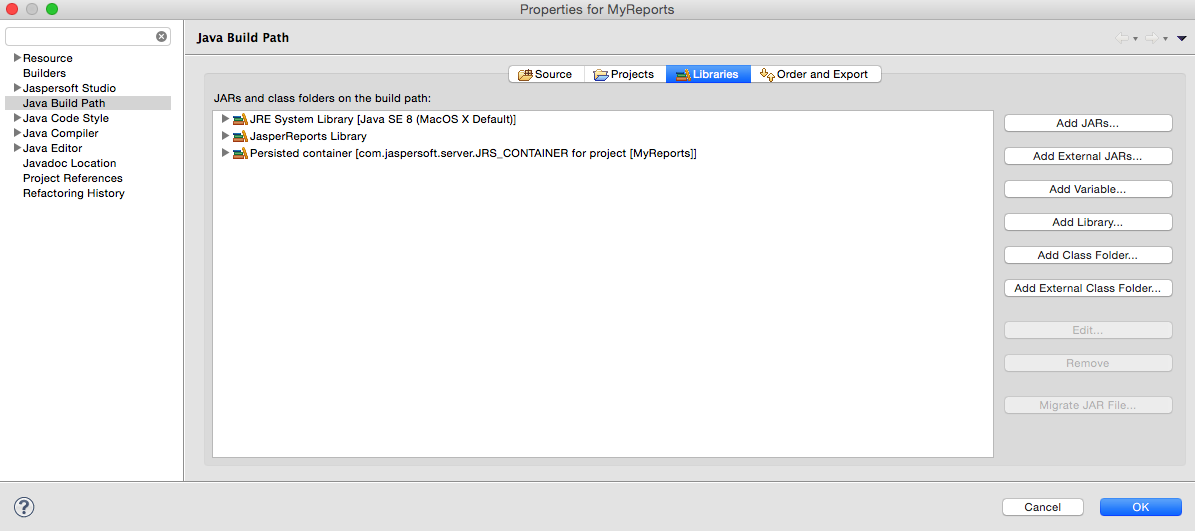
You must add the Measurements Datasource library to Jaspersoft Studio’s build path to use the Measurements API:
-
Open the Project Explorer.
-
Right-click in the window and select Configure Buildpath.
-
Navigate to the Libraries tab:
-
Click Add External JARs.
-
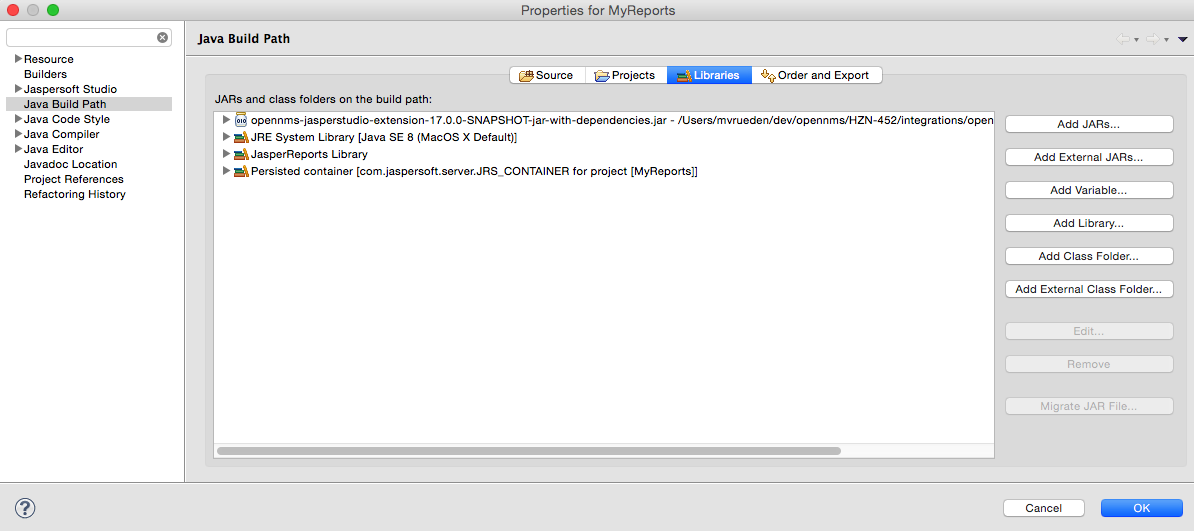
Select
${OPENNMS_HOME}/contrib/jasperstudio-extension/opennms-jasperstudio-extension-{opennms-version}-jar-with-dependencies.jar. -
Close the file selection dialog. The Measurements Datasource and helpers should now be available:
-
Open Jaspersoft Studio and navigate to the Dataset and Query dialog.
-
Select the Measurement language from the Language list:
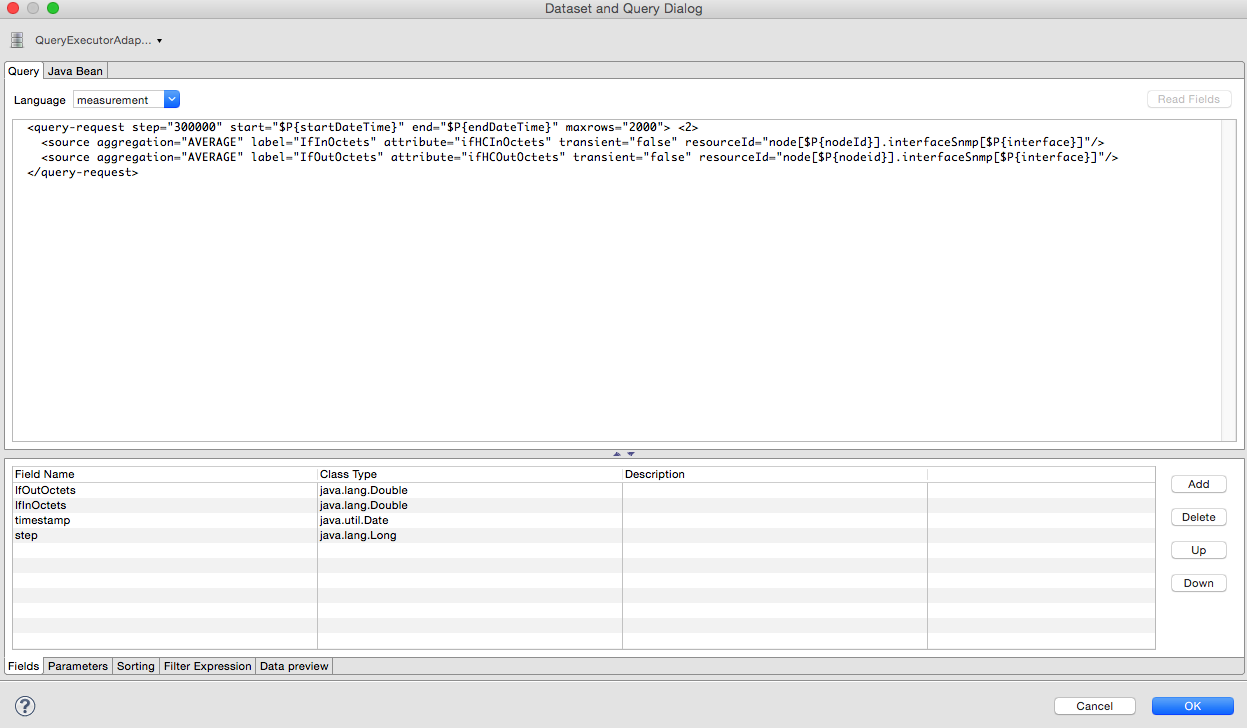
If the Read Fields functionality is not available, use the Data Preview.
To access the Measurements API, use the MEASUREMENT_URL, MEASUREMENT_USERNAME, and MEASUREMENT_PASSWORD parameters (see Datasource fields).
|
Access performance data
The Meridian Measurement Datasource lets you query the Measurements API and process the returned performance data in your reports. See Measurements API for information on how to use the API.
| When you use the Measurements Datasource for a report, an HTTP connection to the Measurements API is established only if the report is not running within Meridian (for example, when run in Jaspersoft Studio). |
To receive data from the Measurements API, create a query:
queryString to receive data from Measurements API<query-request step="300000" start="$P{startDateTime}" end="$P{endDateTime}" maxrows="2000"> (1)
<source aggregation="AVERAGE" label="IfInOctets" attribute="ifHCInOctets" transient="false" resourceId="node[$P\{nodeid}].interfaceSnmp[$P{interface}]"/>
<source aggregation="AVERAGE" label="IfOutOctets" attribute="ifHCOutOctets" transient="false" resourceId="node[$P\{nodeid}].interfaceSnmp[$P{interface}]"/>
</query-request>| 1 | The query language; in this case, measurement.
JasperReports supports many languages out of the box, including SQL, xpath, and so on. |
Datasource fields
Each datasource returns a number of fields which you can use in reports. The Measurement Datasource supports the following fields:
| Name | Description | Type |
|---|---|---|
label |
Each source defined as |
java.lang.Double |
timestamp |
Sample’s timestamp |
java.util.Date |
step |
Response step size. Returns the same value for all rows. |
java.lang.Long |
start |
Timestamp for the beginning of the response, in milliseconds. Returns the same value for all rows. |
java.lang.Long |
end |
Timestamp for the end of the response, in milliseconds. Returns the same value for all rows. |
java.lang.Long |
For more information, see Measurements API.
Parameters
In addition to the queryString, the following JasperReports parameters are supported:
| Parameter | Description |
|---|---|
Required |
|
MEASUREMENTURL |
The URL of the Measurements API (for example, |
Optional |
|
MEASUREMENT_USERNAME |
Username to access the datasource, if required (for example, "admin"). |
MEASUREMENT_PASSWORD |
Password to access the datasource, if required (for example, "admin"). |
Disable report scheduler
To disable the report scheduler, set opennms.report.scheduler.enabled to false.
You can set it in a .properties file in ${OPENNMS_HOME}/etc/opennms.properties.d/.
Helper methods
You can use helper methods to create reports in Meridian. These helpers are included with the Measurement Datasource:
| Helper Method | Description |
|---|---|
getNodeOrNodeSourceDescriptor(nodeId, foreignSource, foreignId) |
Generates a node source descriptor according to the input parameters.
Either |
getInterfaceDescriptor(snmpifname, snmpifdescr, snmpphysaddr) |
Returns the interface descriptor of a given interface (for example, |
Node source descriptors
A node is addressed by a node source descriptor.
The node source descriptor references a node using either its foreign source and foreign ID, or its node ID.
If storeByForeignSource is enabled, you can address the node using only its foreign source and foreign ID (see Storing data with foreign sources on Discourse).
To make report creation easier, the Measurement Datasource includes a helper method that creates the node source descriptor:
<parameter name="nodeResourceDescriptor" class="java.lang.String" isForPrompting="false">
  <defaultValueExpression><![CDATA[org.opennms.netmgt.jasper.helper.MeasurementsHelper.getNodeOrNodeSourceDescriptor(String.valueOf($P{nodeid}), $Pforeignsource, $P{foreignid})]]></defaultValueExpression>
</parameter>
<queryString language="Measurement">
  <![CDATA[<query-request step="300000" start="$P{startDateTime}" end="$P{endDateTime}" maxrows="2000">
<source aggregation="AVERAGE" label="IfInOctets" attribute="ifHCInOctets" transient="false" resourceId="$P{nodeResourceDescriptor}.interfaceSnmp[en0-005e607e9e00]"/>
<source aggregation="AVERAGE" label="IfOutOctets" attribute="ifHCOutOctets" transient="false" resourceId="$P{nodeResourceDescriptor}.interfaceSnmp[en0-005e607e9e00]"/>
</query-request>]]>
Depending on the input parameters, the method returns either a node resource descriptor or a foreign source/foreign ID resource descriptor.
Interface descriptors
An interface is addressed using its exact interface descriptor. The Measurement Datasource includes a helper method that allows easy access to the interface descriptor:
<parameter name="interface" class="java.lang.String" isForPrompting="false">
  <parameterDescription><![CDATA[]]></parameterDescription>
  <defaultValueExpression><![CDATA[org.opennms.netmgt.jasper.helper.MeasurementsHelper.getInterfaceDescriptor($P{snmpifname}, $P{snmpifdescr}, $P{snmpphysaddr})]]></defaultValueExpression>
</parameter>
<queryString language="Measurement">
  <![CDATA[<query-request step="300000" start="$P{startDateTime}" end="$P{endDateTime}" maxrows="2000">
<source aggregation="AVERAGE" label="IfInOctets" attribute="ifHCInOctets" transient="false" resourceId="node[$P{nodeid}].interfaceSnmp[$P{interface}]"/>
<source aggregation="AVERAGE" label="IfOutOctets" attribute="ifHCOutOctets" transient="false" resourceId="node[$P{nodeid}].interfaceSnmp[$P{interface}]"/>
</query-request>]]>
Connect to Measurements API
To establish a secure connection to the Measurements API, you must import your Meridian instance’s public certificate to the Java truststore and configure Meridian to use it (see Configure Meridian to use the Java truststore).
You must also set org.opennms.netmgt.jasper.measurement.ssl.enable to true in ${OPENNMS_HOME}/etc/opennms.properties to ensure that only secure connections are established.
If org.opennms.netmgt.jasper.measurement.ssl.enable is set to false, an insecure connection to the Measurements API can be established.
|