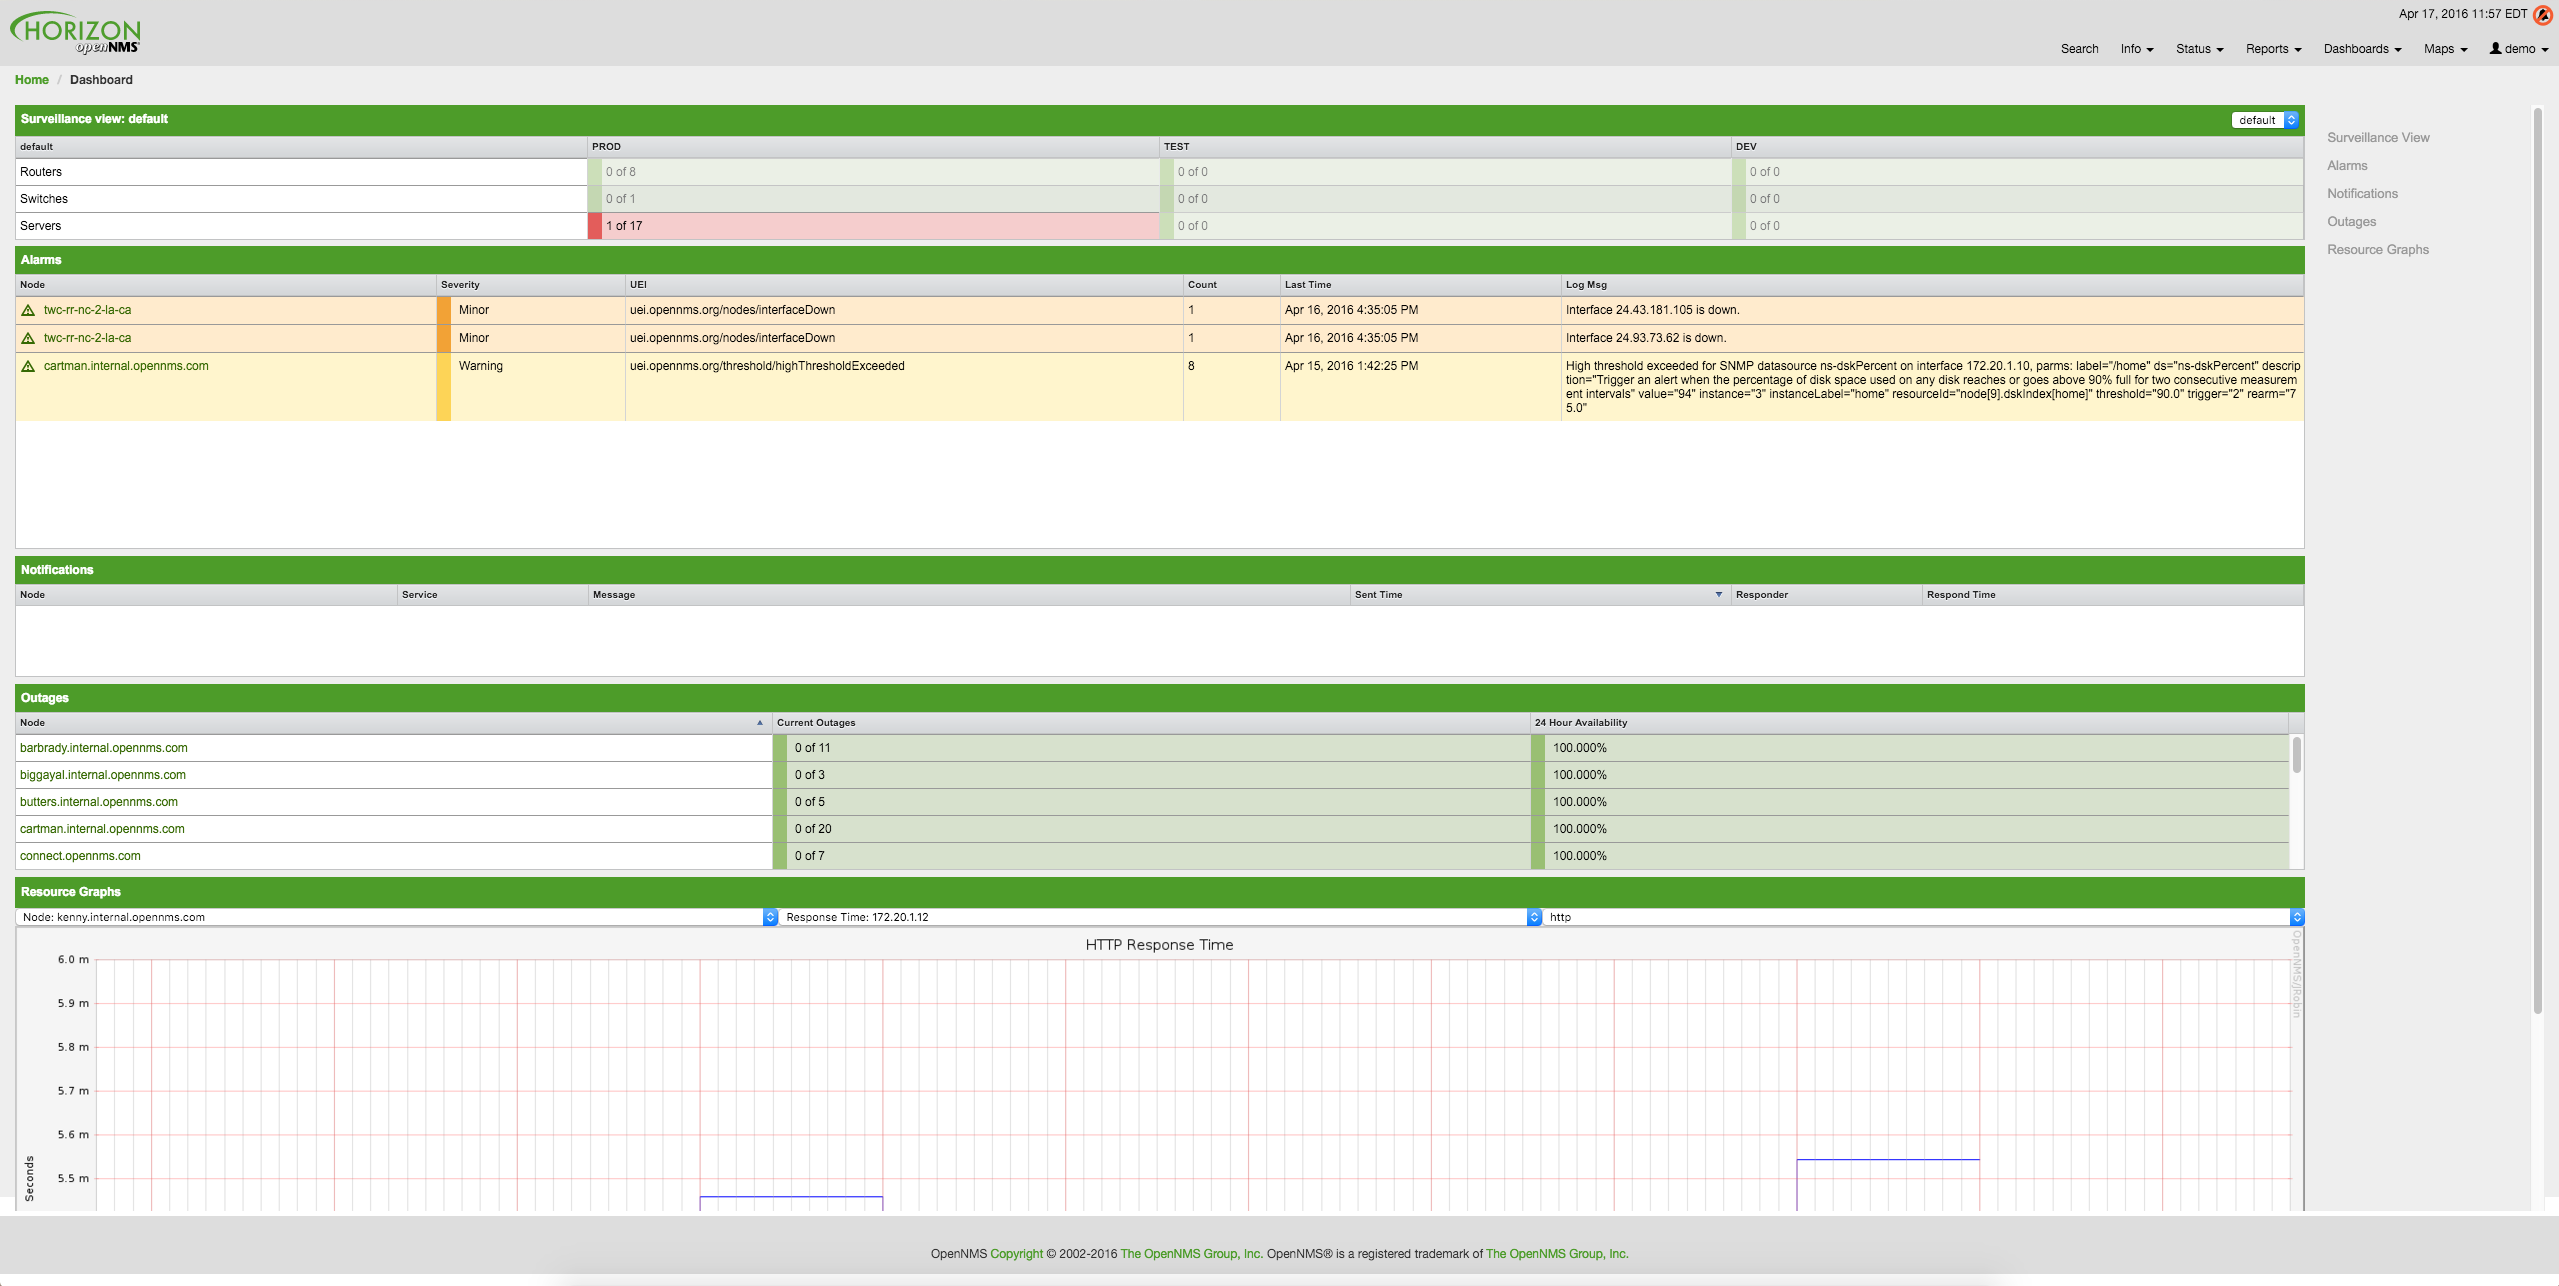
Meridian Dashboard
This section describes the Meridian dashboard and its customization options.
Components
The dashboard includes the following components:
-
Surveillance view: Lets you model a monitoring context for the dashboard.
You can reduce visible information by selecting rows, columns, and cells to focus on. The rest of the dashboard updates dynamically.
-
Alarms: Displays unacknowledged alarms whose severity is higher than
Normal (1). -
Notifications: Displays outstanding and unacknowledged notifications that have been sent to recipients.
-
Outages: Displays all ongoing network outages.
-
Resource graphs: Displays time series reports for performance diagnosis.
You can hide the upper navigation bar on any page by adding ?quiet=true; to the end of any Meridian URL.
This is useful when viewing dashboards on a large screen.
|
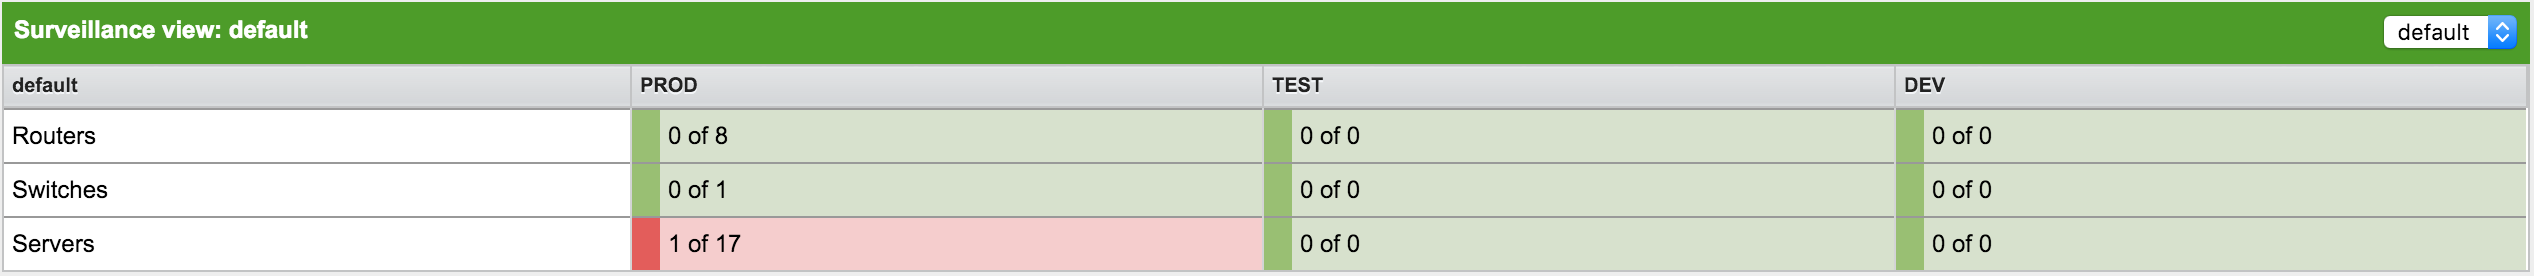
Surveillance view
The surveillance view component lets you create a custom overview of your monitored network. You can tailor the information displayed on your dashboard by selecting rows, columns, and cells to focus on. By default, all entries in a surveillance view are selected.
For more information on configuring the surveillance view component, see Surveillance View.
Alarms
The alarms component displays an overview of all unacknowledged alarms whose severity is higher than Normal (1).
It sorts alarms from most to least recent, and lets you scroll through the last 100 alarms.
Acknowledged alarms are removed from the operator’s responsibility and, therefore, the alarms component.
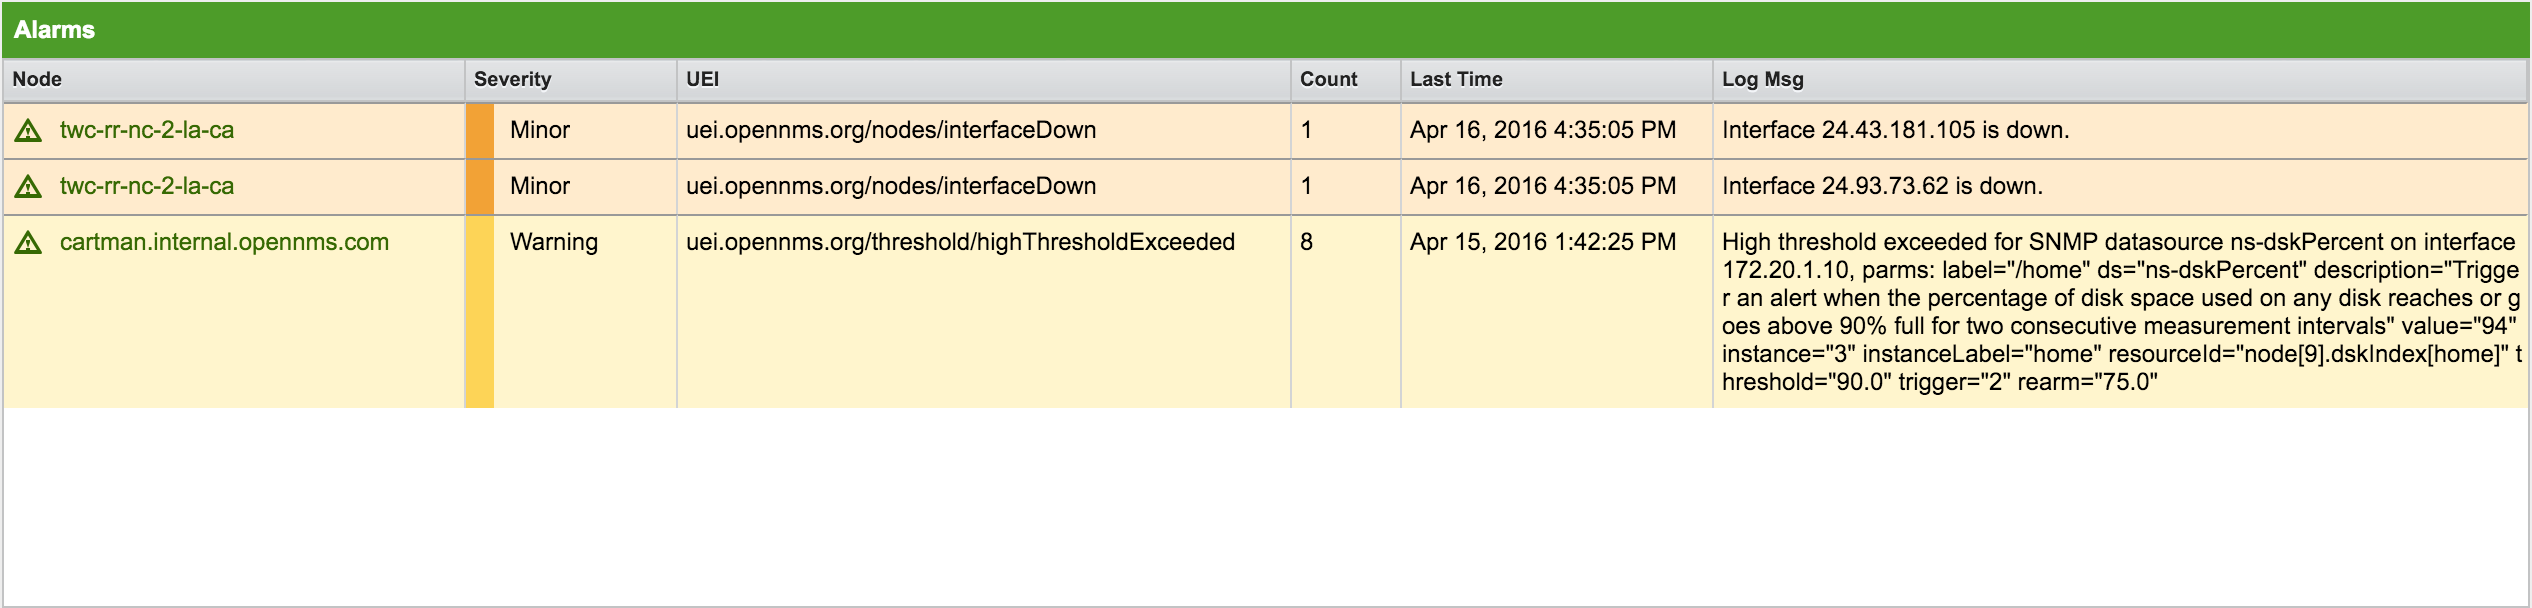
The alarms component displays the following information:
-
Node: The label of the node associated with the alarm.
-
Severity: Alarm severity.
-
UEI: The alarm’s unique event identifier.
-
Count: The number of alarms deduplicated by the alarm’s reduction key.
-
Last Time: The time at which the most recent alarm was generated.
-
Log Msg: The log message from the alarm’s event definition.
Notifications
The notifications component shows outstanding and unacknowledged notifications. It sorts notifications from most to least recent, and lets you scroll through the last 100 notifications. When a notification is acknowledged, it is removed from the component.
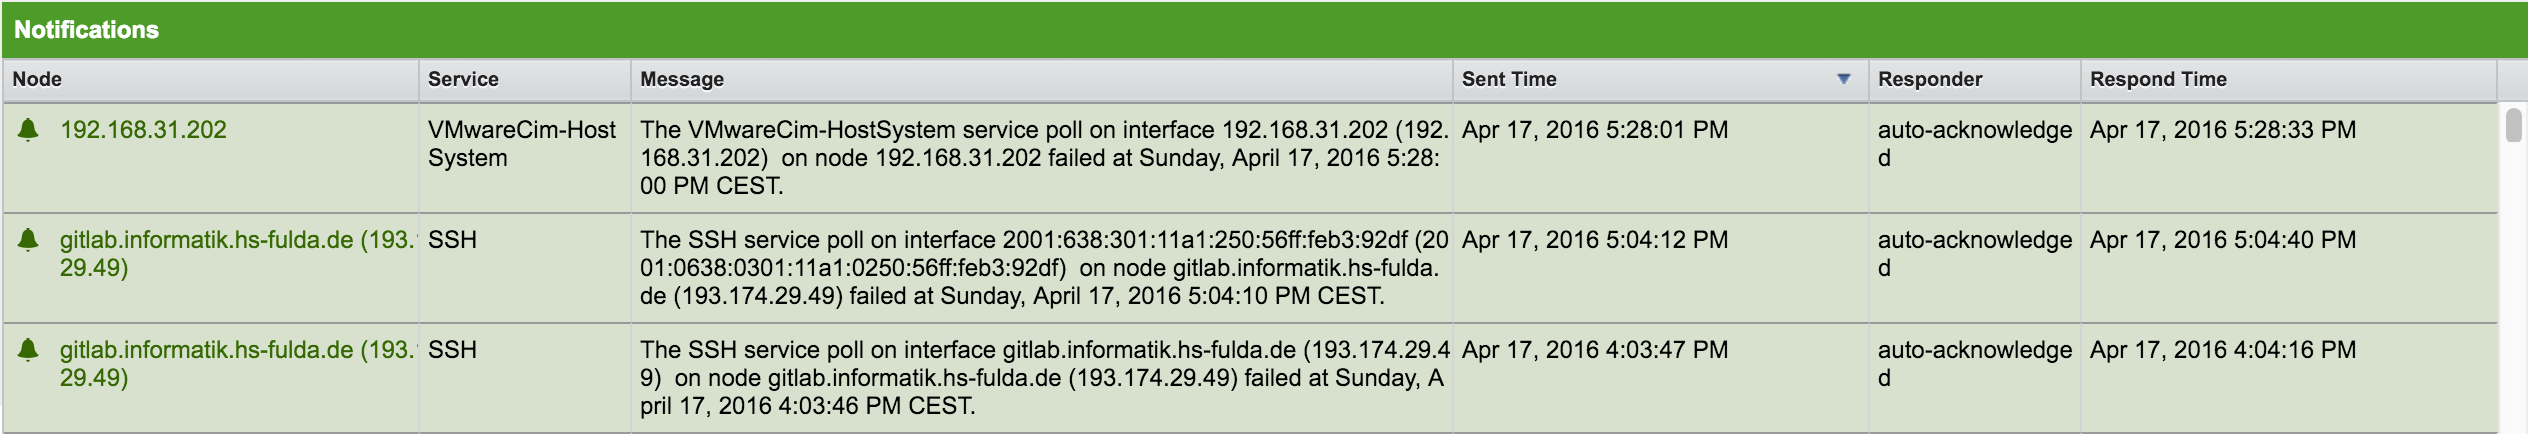
The notifications component shows the following information:
-
Node: The label of the node associated with the notification.
-
Service: The name of the service associated with the notification.
-
Message: The log message associated with the notification.
-
Sent Time: Time when the notification was sent.
-
Responder: Name of the user who acknowledged the notification.
-
Respond Time: The time when the responder acknowledged the notification.
Outages
The outages component shows all ongoing outages in your monitored network. It functions alongside the alarms component to provide a holistic overview of the network.
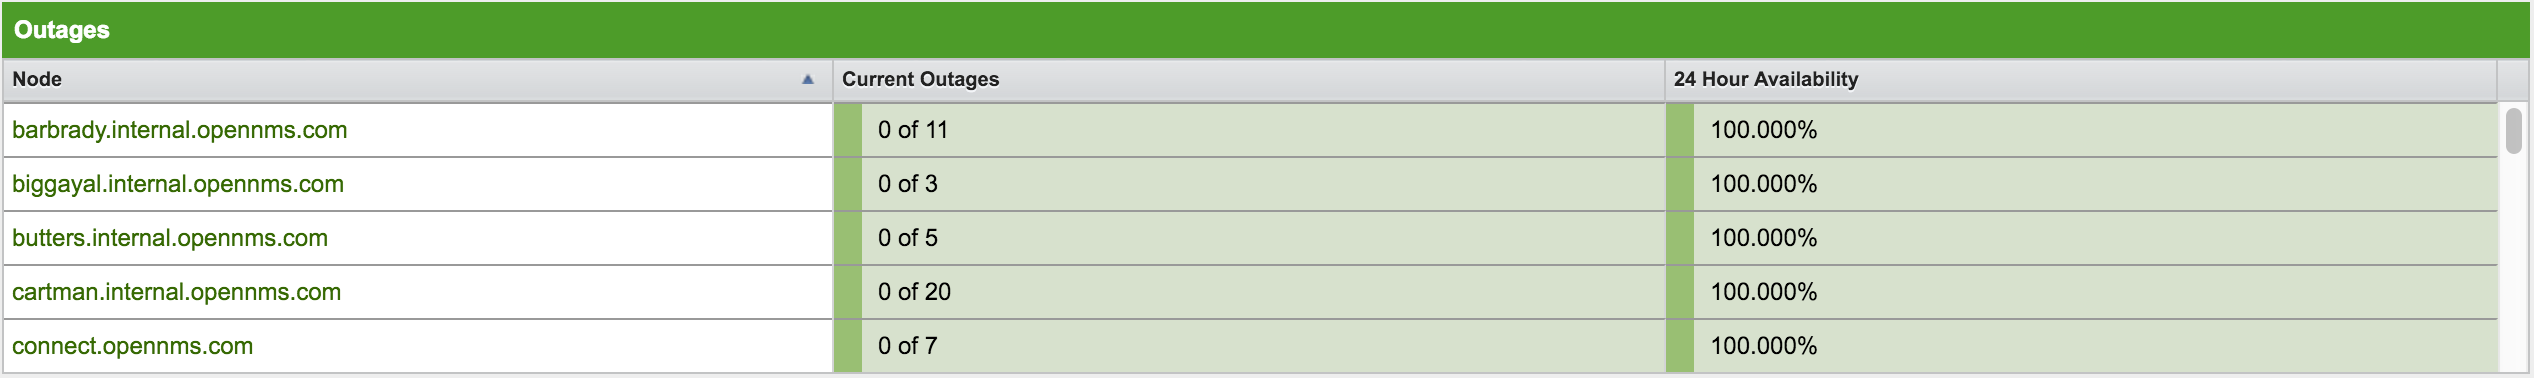
The following information is shown in the outages component:
-
Node: The label of the node associated with the outage.
-
Current Outages: The number of services on the node experiencing outages. The number of outages is listed out of the total number of monitored services (for example, "3 of 3 services are affected").
-
24 Hour Availability: The availability of all node services, calculated across the last 24 hours.
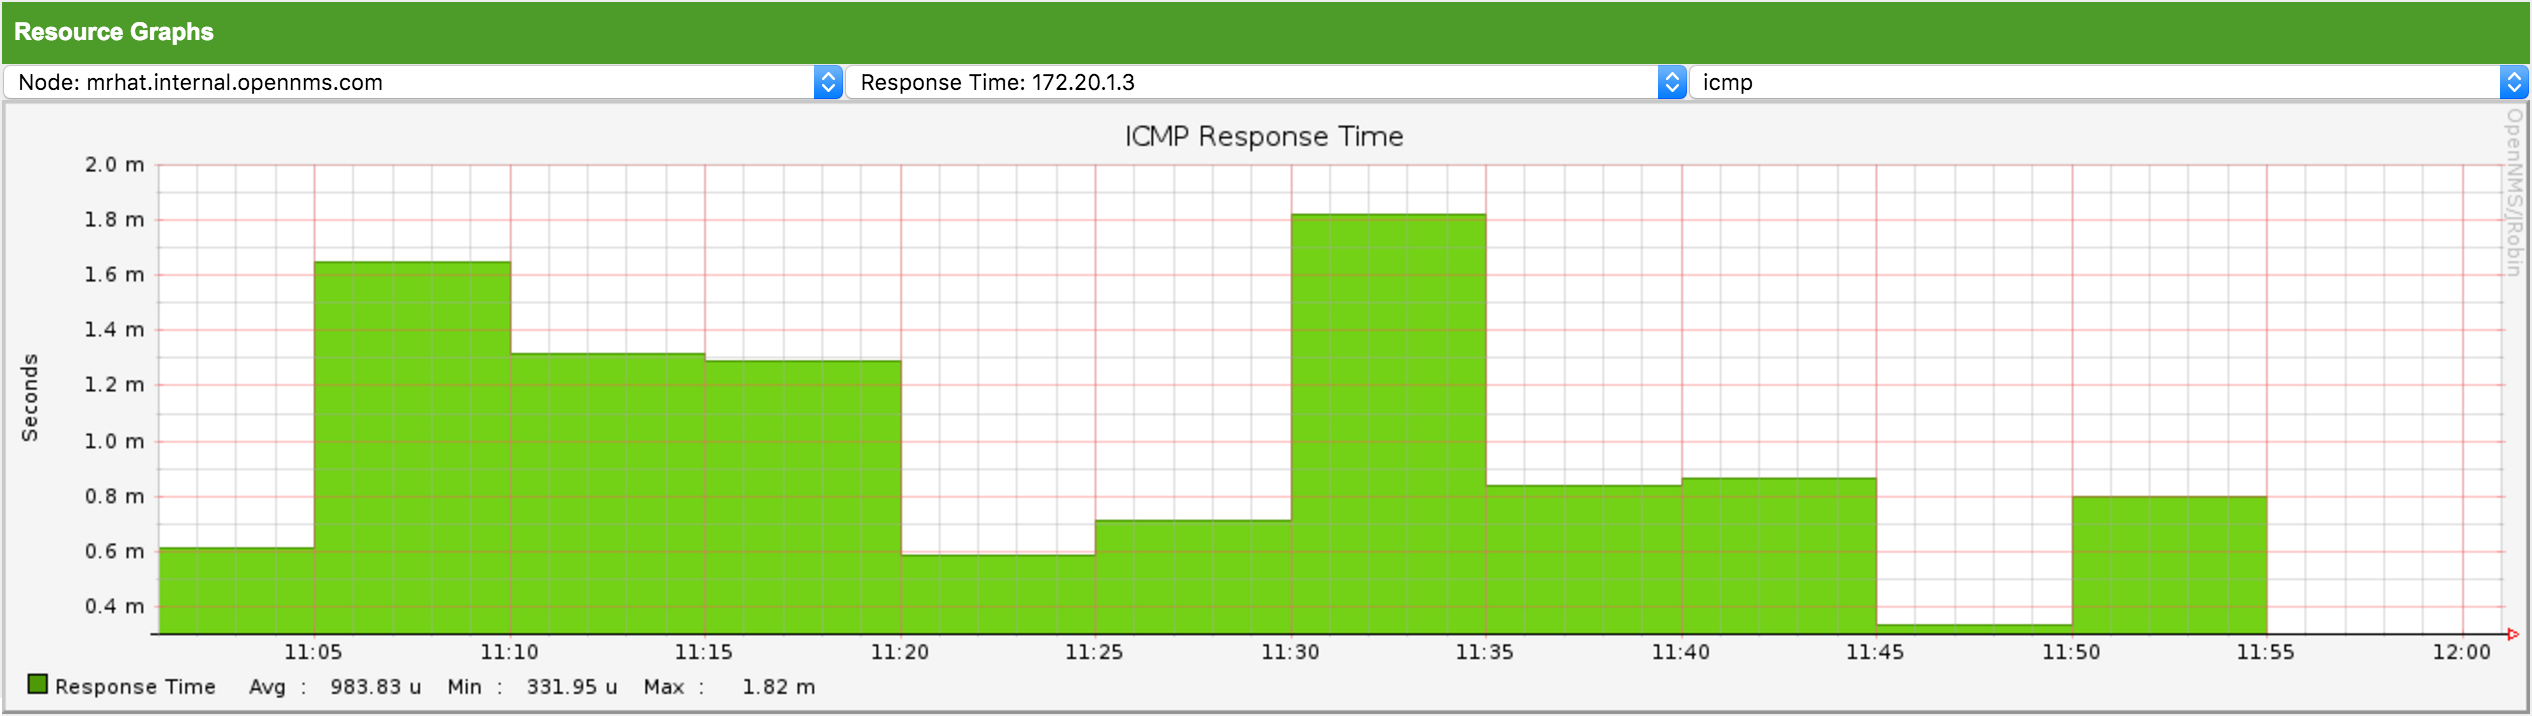
Resource graphs
The resource graphs component shows time series reports across a defined time range. It also lets you navigate to time series data reports, providing a quick entry point from which to diagnose performance issues.
The component filters nodes based on the surveillance view context. It shows only one graph report at a time, and lets you navigate sequentially through the data.
Advanced configuration
The surveillance view component lets you model views for different monitoring contexts. You can use it to create a special view as an example for network or server operators. The dashboard displays only one configured surveillance view. You can, however, let certain users define their surveillance view to fit their requirements by mapping their account to a configured surveillance view component.
Any nodes selected in the surveillance view are also aware of the User Restriction Filter. If you have a group of users who should see only a subset of nodes, the surveillance view filters the data appropriately.
Dashboard role
The dashboard is designed to focus, and therefore also restrict, a user’s view of monitored devices.
To do this, Meridian includes a Dashboard user role (ROLE_PROVISION) that restricts assigned users to viewing only the dashboard.
This procedure shows how to assign the Dashboard role to the drv4doe user:
-
Create a new user named
drv4doe. The user represents a router and switch jockey. -
Add the
ROLE_PROVISIONrole to the account through the web UI or by manually editing${OPENNMS_HOME}/etc/users.xml:-
Web UI:
-
Click the gear symbol at the top-right of the page.
-
Under OpenNMS System, click Configure Users, Groups and On-Call Roles.
-
On the Users and Groups page, click Configure Users.
-
Click Modify beside the
drv4doeaccount. -
In the Security Roles section, select
ROLE_PROVISIONin the Available Roles list and click Add >> to add it to the account. -
Click Finish at the bottom of the page to update the account.
-
-
Manually via code:
-
Add the following code to
${OPENNMS_HOME}/etc/users.xml:<user> <user-id>drv4doe</user-id> <full-name>dashboard User</full-name> <password salt="true">6FOip6hgZsUwDhdzdPUVV5UhkSxdbZTlq8M5LXWG5586eDPa7BFizirjXEfV/srK</password> <role>ROLE_DASHBOARD</role> </user>
-
-
-
Define the surveillance view for
drv4doein${OPENNMS_HOME}/etc/surveillance-view.xml:<?xml version="1.0" encoding="UTF-8"?> <surveillance-view-configuration xmlns:this="http://www.opennms.org/xsd/config/surveillance-views" xmlns:xsi="http://www.w3.org/2001/XMLSchema-instance" xsi:schemaLocation="http://www.opennms.org/xsd/config/surveillance-views http://www.opennms.org/xsd/config/surveillance-views.xsd" default-view="default" > <views > <view name="drv4doe" refresh-seconds="300" > <rows> <row-def label="Servers" > <category name="Servers"/> </row-def> </rows> <columns> <column-def label="PROD" > <category name="Production" /> </column-def> <column-def label="TEST" > <category name="Test" /> </column-def> </columns> </view> <!-- default view here --> <view name="default" refresh-seconds="300" > <rows> <row-def label="Routers" > <category name="Routers"/> </row-def> <row-def label="Switches" > <category name="Switches" /> </row-def> <row-def label="Servers" > <category name="Servers" /> </row-def> </rows> <columns> <column-def label="PROD" > <category name="Production" /> </column-def> <column-def label="TEST" > <category name="Test" /> </column-def> <column-def label="DEV" > <category name="Development" /> </column-def> </columns> </view> </views> </surveillance-view-configuration>
When a user logs in using the drv4doe account, they are taken directly to the dashboard page and presented with a custom dashboard based on the drv4doe surveillance view definition.
All other users will see the default dashboard.
The drv4doe account is not allowed to navigate to other Meridian URLs; trying to do so results in an "access denied" error.
|
Anonymous dashboards
You can modify the security framework configuration files to allow access to one or more dashboards without requiring a user to log in:
-
Create users and configure surveillance views as required (see Dashboard role). For this example, we will create two dashboards and two users:
dashboard1anddashboard2. -
Edit
${OPENNMS_HOME}/jetty-webapps/opennms/WEB-INF/web.xmlto create aliases for the dashboards:-
Add the following code just before the first
<servlet-mapping>tag:<servlet> <servlet-name>dashboard1</servlet-name> <jsp-file>/dashboard.jsp</jsp-file> </servlet> <servlet> <servlet-name>dashboard2</servlet-name> <jsp-file>/dashboard.jsp</jsp-file> </servlet> -
Add the following code just before the first
<error-page>tag:<servlet-mapping> <servlet-name>dashboard1</servlet-name> <url-pattern>/dashboard1</url-pattern> </servlet-mapping> <servlet-mapping> <servlet-name>dashboard2</servlet-name> <url-pattern>/dashboard2</url-pattern> </servlet-mapping> -
Add the following code after the final
<filter-mapping>tag:<filter-mapping> <filter-name>AddRefreshHeader-120</filter-name> <url-pattern>/dashboard.jsp</url-pattern> </filter-mapping> <filter-mapping> <filter-name>AddRefreshHeader-120</filter-name> <url-pattern>/dashboard1</url-pattern> </filter-mapping> <filter-mapping> <filter-name>AddRefreshHeader-120</filter-name> <url-pattern>/dashboard2</url-pattern> </filter-mapping>
-
-
Edit
${OPENNMS_HOME}/jetty-webapps/opennms/WEB-INF/applicationContext-acegi-security.xmlto enable anonymous authentication for the/dashboard1and/dashboard2aliases:-
Add the following code in the
<bean id="filterChainProxy" …>block, after the entry for/rss.jsp*:<bean id="filterChainProxy" class="org.acegisecurity.util.FilterChainProxy"> <property name="filterInvocationDefinitionSource"> <value> CONVERT_URL_TO_LOWERCASE_BEFORE_COMPARISON PATTERN_TYPE_APACHE_ANT /rss.jsp*=httpSessionContextIntegrationFilter,logoutFilter,authenticationProcessingFilter,basicProcessingFilter,securityContextHolderAwareRequestFilter,anonymousProcessingFilter,basicExceptionTranslationFilter,filterInvocationInterceptor /dashboard1*=httpSessionContextIntegrationFilter,logoutFilter,securityContextHolderAwareRequestFilter,dash1AnonymousProcessingFilter,filterInvocationInterceptor /dashboard2*=httpSessionContextIntegrationFilter,logoutFilter,securityContextHolderAwareRequestFilter,dash2AnonymousProcessingFilter,filterInvocationInterceptor /**=httpSessionContextIntegrationFilter,logoutFilter,authenticationProcessingFilter,basicProcessingFilter,securityContextHolderAwareRequestFilter,anonymousProcessingFilter,exceptionTranslationFilter,filterInvocationInterceptor ... -
Add the following code in the
<bean id="filterInvocationInterceptor" …>block, after the entry for/dashboard.jsp:<bean id="filterInvocationInterceptor" class="org.acegisecurity.intercept.web.FilterSecurityInterceptor"> ... /frontpage.htm=ROLE_USER,ROLE_DASHBOARD /dashboard.jsp=ROLE_USER,ROLE_DASHBOARD /dashboard1=ROLE_USER,ROLE_DASHBOARD /dashboard2=ROLE_USER,ROLE_DASHBOARD /gwt.js=ROLE_USER,ROLE_DASHBOARD ... -
Add a new
AnonymousProcessingFilterinstance for each alias near the bottom of the file:<!-- Set the anonymous username to dashboard1 so the dashboard page can match it to a surveillance view of the same name. --> <bean id="dash1AnonymousProcessingFilter" class="org.acegisecurity.providers.anonymous.AnonymousProcessingFilter"> <property name="key"><value>foobar</value></property> <property name="userAttribute"><value>dashboard1,ROLE_DASHBOARD</value></property> </bean> <bean id="dash2AnonymousProcessingFilter" class="org.acegisecurity.providers.anonymous.AnonymousProcessingFilter"> <property name="key"><value>foobar</value></property> <property name="userAttribute"><value>dashboard2,ROLE_DASHBOARD</value></property> </bean>
-
-
Restart Meridian.
-
Navigate to
http://hostname/opennms/dashboard1to test your settings. You should be able to see a dashboard without logging in.
Note that you cannot view another dashboard without closing your browser or deleting the JSESSIONID cookie.
If you accidentally click a link that requires full user privileges, you will see a login form.
Once you are directed to the login form, you cannot return to the anonymous dashboard without restarting your browser.
If this bothers you, you can set the ROLE_USER role alongside the ROLE_DASHBOARD role in the userAttribute property definition.
Note, however, that setting this role provides full user access to anonymous browsers.
|