StrafePingMonitor
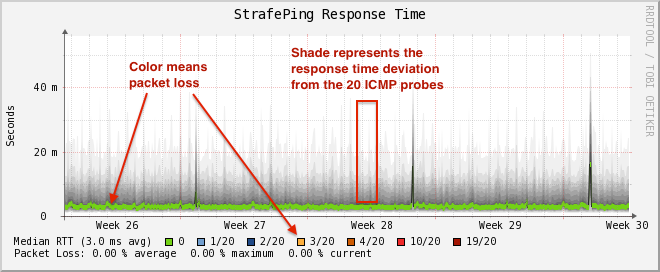
This monitor uses ICMP to monitor packet delay variation to a specific endpoint. The main use case is to monitor a WAN endpoint and visualize packet loss and ICMP packet round-trip time deviation. The StrafePingMonitor performs multiple ICMP echo requests (pings) and stores the response time of each as well as the packet loss.
This monitor is typically used on WAN connections and not activated for every ICMP-enabled device in your network. Since StrafePingMonitor requires many more I/O requests than a single IcmpMonitor poll, use this monitor only where necessary to check packet loss.
Credit to Tobias Oetiker, as graphing of this feature is an adaptation of the SmokePing tool that he developed.
Configuration and use
| Parameter | Description | Default |
|---|---|---|
Required |
||
ping-count |
The number of pings to attempt each interval. |
20 |
failure-ping-count |
The number of pings that need to fail for the service to be considered down. |
20 |
wait-interval |
Time in milliseconds to wait between each ICMP echo-request packet. |
50 |
rrd-repository |
The location to write RRD data. Generally, you will not want to change this from the default. |
$OPENNMS_HOME/share/rrd/response |
rrd-base-name |
The name of the RRD file to write (minus the extension, .rrd or .jrb). |
strafeping |
Optional |
||
timeout |
Time in milliseconds to wait before assuming that a packet has not responded. |
800 |
retry |
The number of retries to attempt when a packet fails to respond in the given timeout. |
2 |
allow-fragmentation |
Whether to set the "Don’t Fragment" bit on outgoing packets. |
true |
dscp |
DSCP traffic-control value. |
0 |
packet-size |
Number of bytes of the ICMP packet to send. |
64 |
This monitor implements the Common Configuration Parameters.
Examples
By default, you can find a separate poller package in poller-configuration.xml called strafer.
Configure the include-range or a filter to enable monitoring for devices with the service StrafePing.
The following example enables the monitoring for the StrafePing service on IP interfaces in the range 10.0.0.1 to 10.0.0.20.
Additionally, you must assign the nodes to a surveillance category named Latency.
Example uses CentOS/RHEL path name.
For Debian/Ubuntu, use /var/lib/opennms/rrd/response.
<package name="strafer" >
  <filter>categoryName == 'Latency'</filter>
  <include-range begin="10.0.0.1" end="10.0.0.20"/>
  <rrd step="300">
    <rra>RRA:AVERAGE:0.5:1:2016</rra>
    <rra>RRA:AVERAGE:0.5:12:1488</rra>
    <rra>RRA:AVERAGE:0.5:288:366</rra>
    <rra>RRA:MAX:0.5:288:366</rra>
    <rra>RRA:MIN:0.5:288:366</rra>
  </rrd>
  <service name="StrafePing" interval="300000" user-defined="false" status="on">
    <parameter key="retry" value="0"/>
    <parameter key="timeout" value="3000"/>
    <parameter key="ping-count" value="20"/>
    <parameter key="failure-ping-count" value="20"/>
    <parameter key="wait-interval" value="50"/>
    <parameter key="rrd-repository" value="/opt/opennms/share/rrd/response"/>
    <parameter key="rrd-base-name" value="strafeping"/>
  </service>
  <downtime interval="30000" begin="0" end="300000"/>
  <downtime interval="300000" begin="300000" end="43200000"/>
  <downtime interval="600000" begin="43200000" end="432000000"/>
  <downtime begin="432000000" delete="true"/>
</package>
<monitor service="StrafePing" class-name="org.opennms.netmgt.poller.monitors.StrafePingMonitor"/>