Trend
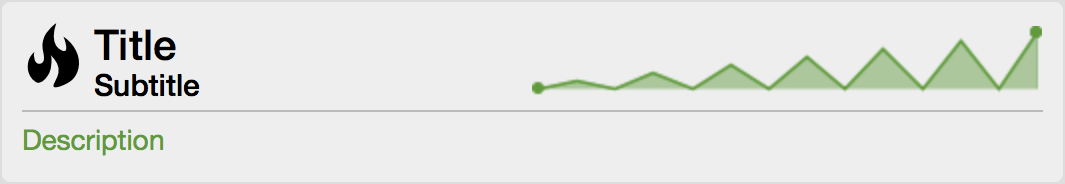
The Trend feature lets you display small inline charts of database-based statistics.
These chart are accessible in the Status menu of the OpenNMS web application.
Furthermore it is also possible to configure these charts to be displayed on the OpenNMS landing page.
To achieve this alter the org.opennms.web.console.centerUrl property to also include the entry /trend/trend-box.htm.
These charts can be configured and defined in the trend-configuration.xml file in your OpenNMS etc directory.
The following sample defines a Trend chart for displaying nodes with ongoing outages.
<trend-definition name="nodes">
    <title>Nodes</title> (1)
    <subtitle>w/ Outages</subtitle> (2)
    <visible>true</visible> (3)
    <icon>fa-fire</icon> (4)
    <trend-attributes> (5)
        <trend-attribute key="sparkWidth" value="100%"/>
        <trend-attribute key="sparkHeight" value="35"/>
        <trend-attribute key="sparkChartRangeMin" value="0"/>
        <trend-attribute key="sparkLineColor" value="white"/>
        <trend-attribute key="sparkLineWidth" value="1.5"/>
        <trend-attribute key="sparkFillColor" value="#88BB55"/>
        <trend-attribute key="sparkSpotColor" value="white"/>
        <trend-attribute key="sparkMinSpotColor" value="white"/>
        <trend-attribute key="sparkMaxSpotColor" value="white"/>
        <trend-attribute key="sparkSpotRadius" value="3"/>
        <trend-attribute key="sparkHighlightSpotColor" value="white"/>
        <trend-attribute key="sparkHighlightLineColor" value="white"/>
    </trend-attributes>
    <descriptionLink>outage/list.htm?outtype=current</descriptionLink> (6)
    <description>${intValue[23]} NODES WITH OUTAGE(S)</description> (7)
    <query> (8)
        <![CDATA[
            select (
                select
                    count(distinct nodeid)
                from
                    outages o, events e
                where
                    e.eventid = o.svclosteventid
                    and iflostservice < E
                    and (ifregainedservice is null
                        or ifregainedservice > E)
            ) from (
                select
                    now() - interval '1 hour' * (O + 1) AS S,
                    now() - interval '1 hour' * O as E
                from
                    generateseries(0, 23) as O
            ) I order by S;
        ]]>
    </query>
</trend-definition>| 1 | title of the Trend chart, see below for supported variable substitutions |
| 2 | subtitle of the Trend chart, see below for supported variable substitutions |
| 3 | defines whether the chart is visible by default |
| 4 | icon for the chart, see Icons for viable options |
| 5 | options for inline chart, see jQuery Sparklines for viable options |
| 6 | the description link |
| 7 | the description text, see below for supported variable substitutions |
| 8 | the SQL statement for querying the chart’s values |
| Don’t forget to limit the SQL query’s return values! |
It is possible to use values or aggregated values in the title, subtitle and description fields. The following table describes the available variable substitutions.
| Name | Description | Type |
|---|---|---|
${intmax} |
integer maximum value |
Integer |
${doublemax} |
Double |
maximum value |
${intmin} |
Integer |
integer minimum value |
${doublemin} |
Double |
minimum value |
${intavg} |
Integer |
integer average value |
${doubleavg} |
Double |
average value |
${intsum} |
Integer |
integer sum of values |
${doublesum} |
Double |
sum of value |
${intValue[]} |
Integer |
array of integer result values for the given SQL query |
{doubleValue[]} |
Double |
array of result values for the given SQL query |
${intValueChange[]} |
Integer |
array of integer value changes for the given SQL query |
${doubleValueChange[]} |
Double |
array of value changes for the given SQL query |
${intlastvalue} |
Integer |
last integer value |
${doublelastvalue} |
Double |
last value |
${intlastvaluechange} |
Integer |
last integer value change |
${doublelastvaluechange} |
Double |
last value change |
You can also display a single graph in your JSP files by including the file /trend/single-trend-box.jsp and specifying the name parameter.
<jsp:include page="/trend/single-trend-box.jsp" flush="false">
    <jsp:param name="name" value="example"/>
</jsp:include>