Grafana Dashboard Reports
Meridian provides three templates to create a PDF report from an existing Grafana dashboard. You can also schedule and email these PDF reports to anyone:
-
Keep staff without access to Meridian informed about network performance for improved capacity planning
-
Create a permanent record of strategic information and progress over a long period of time
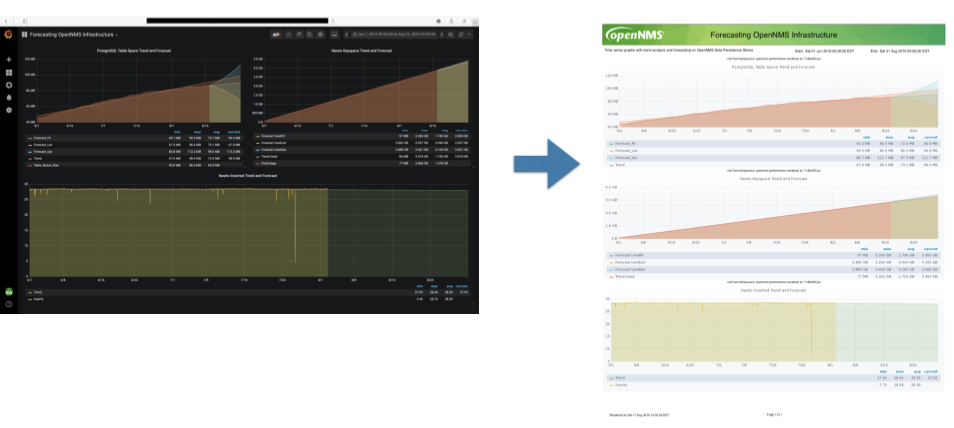
The PDF report displays each of the panels from the specified dashboard, with one, two, or four panels per page, depending on the selected template.
Dashboard to PDF:
Before you begin
This feature requires Meridian and an instance of Grafana with at least one dashboard and panel. OpenNMS lets you create a report for any Grafana dashboard, not just those created using OpenNMS Helm.
You must set up Grafana as a data source by configuring the Grafana endpoint in Meridian.
If you are using the Docker image for Grafana, you must complete additional configuration. Refer to Grafana’s Remote rendering service documentation for more information on how to set up remote rendering. Additional details are available on GitHub.
Configure the Grafana endpoint
Configuring the Grafana endpoint sets up Grafana as the data source for the dashboards from which you create PDFs.
-
Login to your Grafana instance.
-
Choose .
-
Specify a key name and "Viewer" role and click Add.
-
Leave the time to live blank so that the key never expires.
-
-
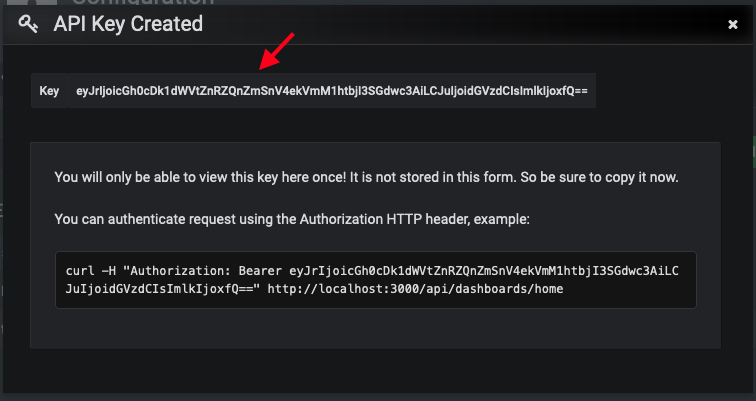
Copy the key so that you can paste it into the Meridian UI.
-
If desired, use the cURL command provided in the API key dialog to test the key.
-
-
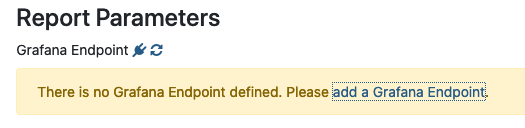
In OpenNMS, click Please add a Grafana endpoint:
-
In the Endpoint Configuration screen click the plus sign on the right to add a new endpoint.
-
Fill in the information and click Test Connection.
-
Click Create.
You can now use Meridian to create PDF reports of Grafana dashboards.
Create a PDF of a Grafana dashboard
-
In the Meridian UI, choose .
-
In the Report Templates area, click Grafana Dashboard Report <Xppp>, where <Xppp> represents the number of panels per page you want to display.
-
In the Report Parameters area, specify the appropriate information (see table below).
-
Note that Grafana Endpoint is the data source. Select a Grafana dashboard from the list.
-
You can also specify CSV for report type.
-
-
Click Create Report.
-
You are prompted to save the report locally or open it. The file is saved to a folder on the Meridian server. It also appears in the UI in the Persisted Reports tab.
-
-
To send the report to someone, click Deliver this report.
-
Fill out the Report Delivery Options.
-
If you select Email report, specify the recipient’s email address in the Recipient field. Separate multiple recipient emails with a comma.
-
Webhook lets you post the generated report to the specified URL.
-
-
Click Deliver Report.
-
To schedule the report for regular delivery, click Schedule this report.
-
Specify the report frequency (daily, days per week, and so on) and interval of the report.
-
Click Schedule Report.
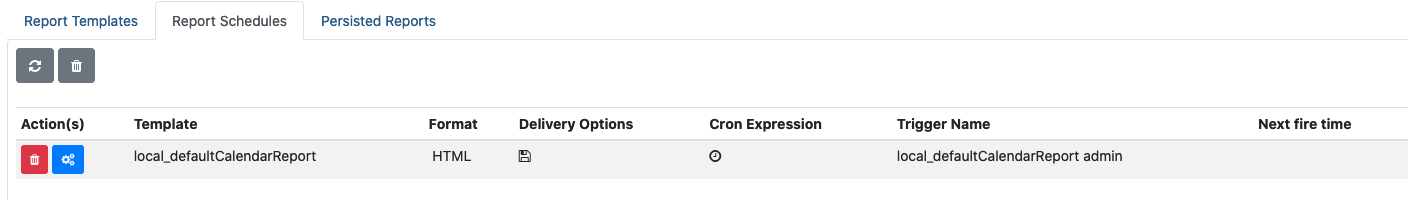
Scheduled reports appear in the Report Schedules tab, where you can edit or delete them:
Parameters
| Field | Description | Default |
|---|---|---|
Title |
Title for the report. |
"Grafana Dashboard Report" |
Description |
Brief description of the report |
|
Time Zone |
The time zone for the data in this report. A dropdown provides all the available options. |
Default System Time Zone |
Start Date |
Select the start date for the report. |
Yesterday |
End Date |
Select the end date for the report |
Today |