Surveillance View
When networks are larger and contain devices of different priority, it becomes interesting to show at a glance how the "whole system" is working. The surveillance view aims to do that. By using categories, you can define a matrix which lets you aggregate monitoring results. Imagine you have 10 servers with 10 internet connections and some 5 PCs with DSL lines:
| Servers | Internet Connections | |
|---|---|---|
Super important |
1 of 10 |
0 of 10 |
Slightly important |
0 of 10 |
0 of 10 |
Vanity |
4 of 10 |
0 of 10 |
The whole idea is to give somebody at a glance a hint on where the trouble is. The matrix-type of display enables a significantly higher aggregation than the simple list. In addition, the surveillance view shows nodes rather than services - an important tidbit of information when you look at categories. At a glance, you want to know how many of my servers have an issue rather than how many services in this category have an issue.
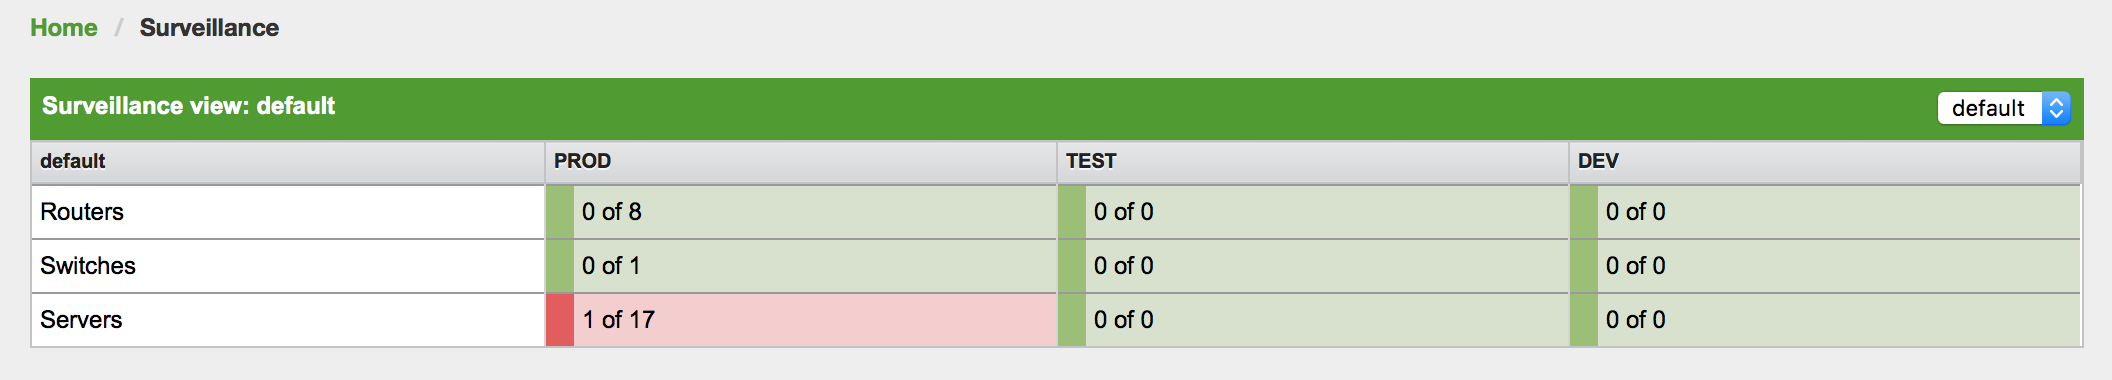
The visual indication for outages in the surveillance view cells is defined as the following:
-
No services down: green as normal
-
One (1) service down: yellow as warning
-
More than one (1) services down: red as critical
This Surveillance View model also builds the foundation of the Dashboard View.
Default Surveillance View Configuration
Surveillance Views are defined in the surveillance-views.xml file.
This file resides in the Meridian etc directory.
| This file can be modified in a text editor and is reread every time the Surveillance View page is loaded. Thus, changes to this file do not require Meridian to be restarted. |
The default configuration looks like this:
<?xml version="1.0" encoding="UTF-8"?>
<surveillance-view-configuration
  xmlns:this="http://www.opennms.org/xsd/config/surveillance-views"
  xmlns:xsi="http://www.w3.org/2001/XMLSchema-instance"
  xsi:schemaLocation="http://www.opennms.org/xsd/config/surveillance-views http://www.opennms.org/xsd/config/surveillance-views.xsd"
  default-view="default" >
  <views >
    <view name="default" refresh-seconds="300" >
      <rows>
        <row-def label="Routers" >
          <category name="Routers"/>
        </row-def>
        <row-def label="Switches" >
          <category name="Switches" />
        </row-def>
        <row-def label="Servers" >
          <category name="Servers" />
        </row-def>
      </rows>
      <columns>
        <column-def label="PROD" >
          <category name="Production" />
        </column-def>
        <column-def label="TEST" >
          <category name="Test" />
        </column-def>
        <column-def label="DEV" >
          <category name="Development" />
        </column-def>
      </columns>
    </view>
  </views>
</surveillance-view-configuration>
Please note, that the old report-category attribute is deprecated and is no longer supported.
|
Configuring Surveillance Views
The Surveillance View configuration can also be modified using the Surveillance View Configurations editor on the Meridian Admin page.
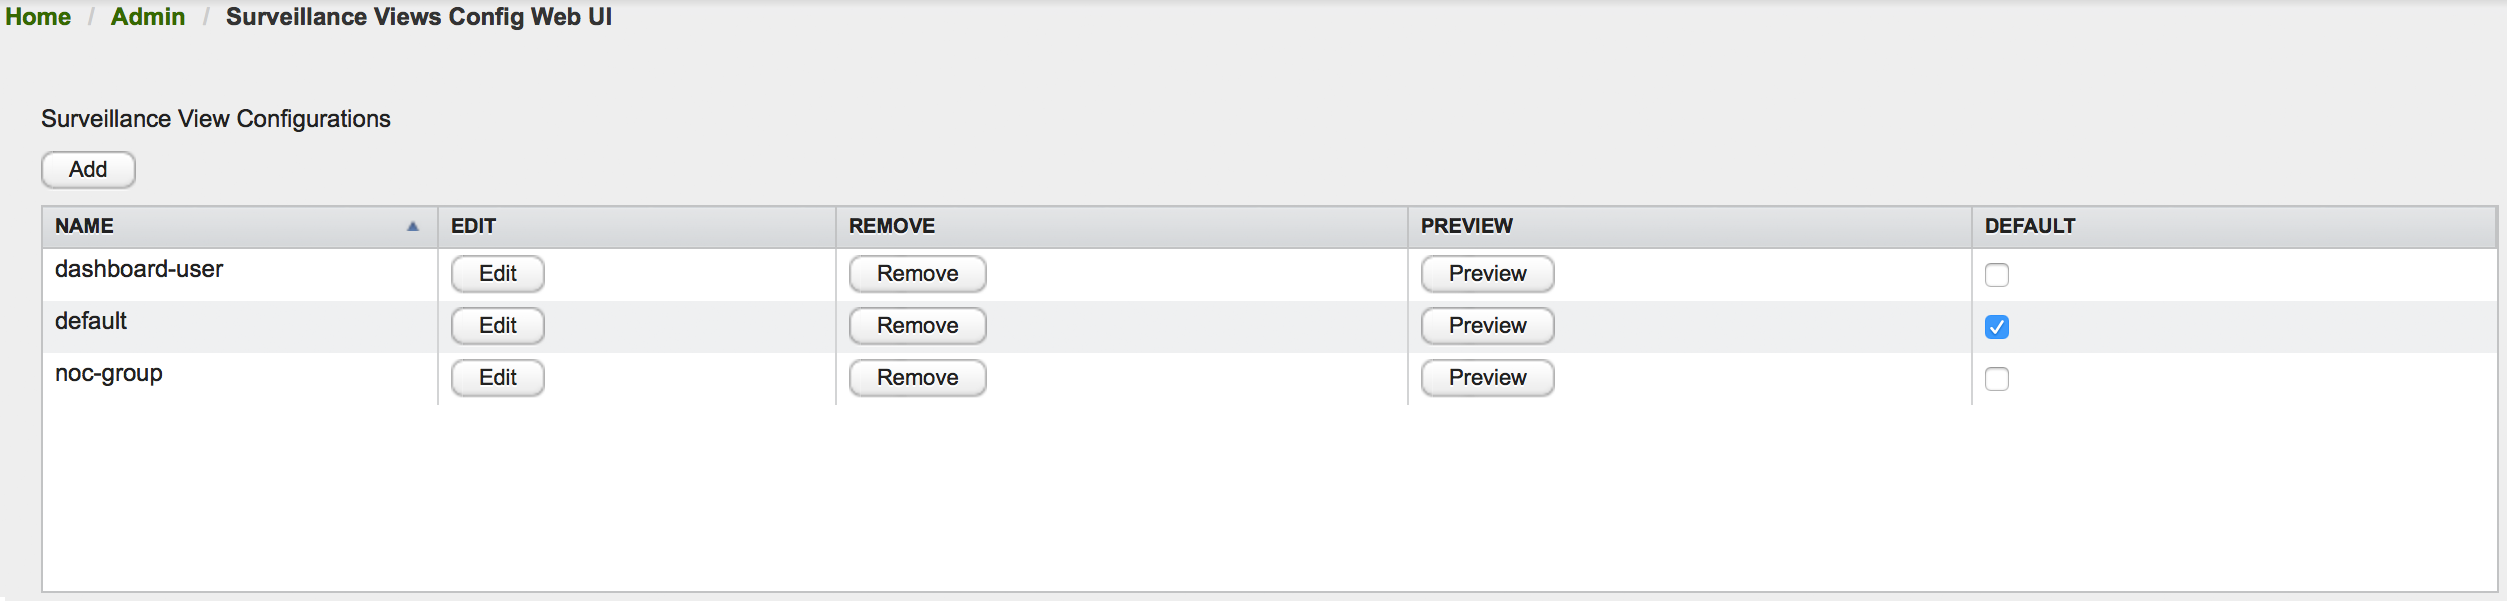
This page gives an overview of the configured Surveillance Views and lets you edit, remove, or even preview the defined Surveillance View. Furthermore, you can select the default Surveillance View using the check box in the DEFAULT column.
When editing a Surveillance View the user has to define the view’s title and the time in seconds between successive refreshes. On the left side of this dialog the defined rows, on the right side the defined columns are listed. Beside adding new entries an user can modify or delete existing entries. Furthermore, the position of an entry can be modified using the up/down buttons.
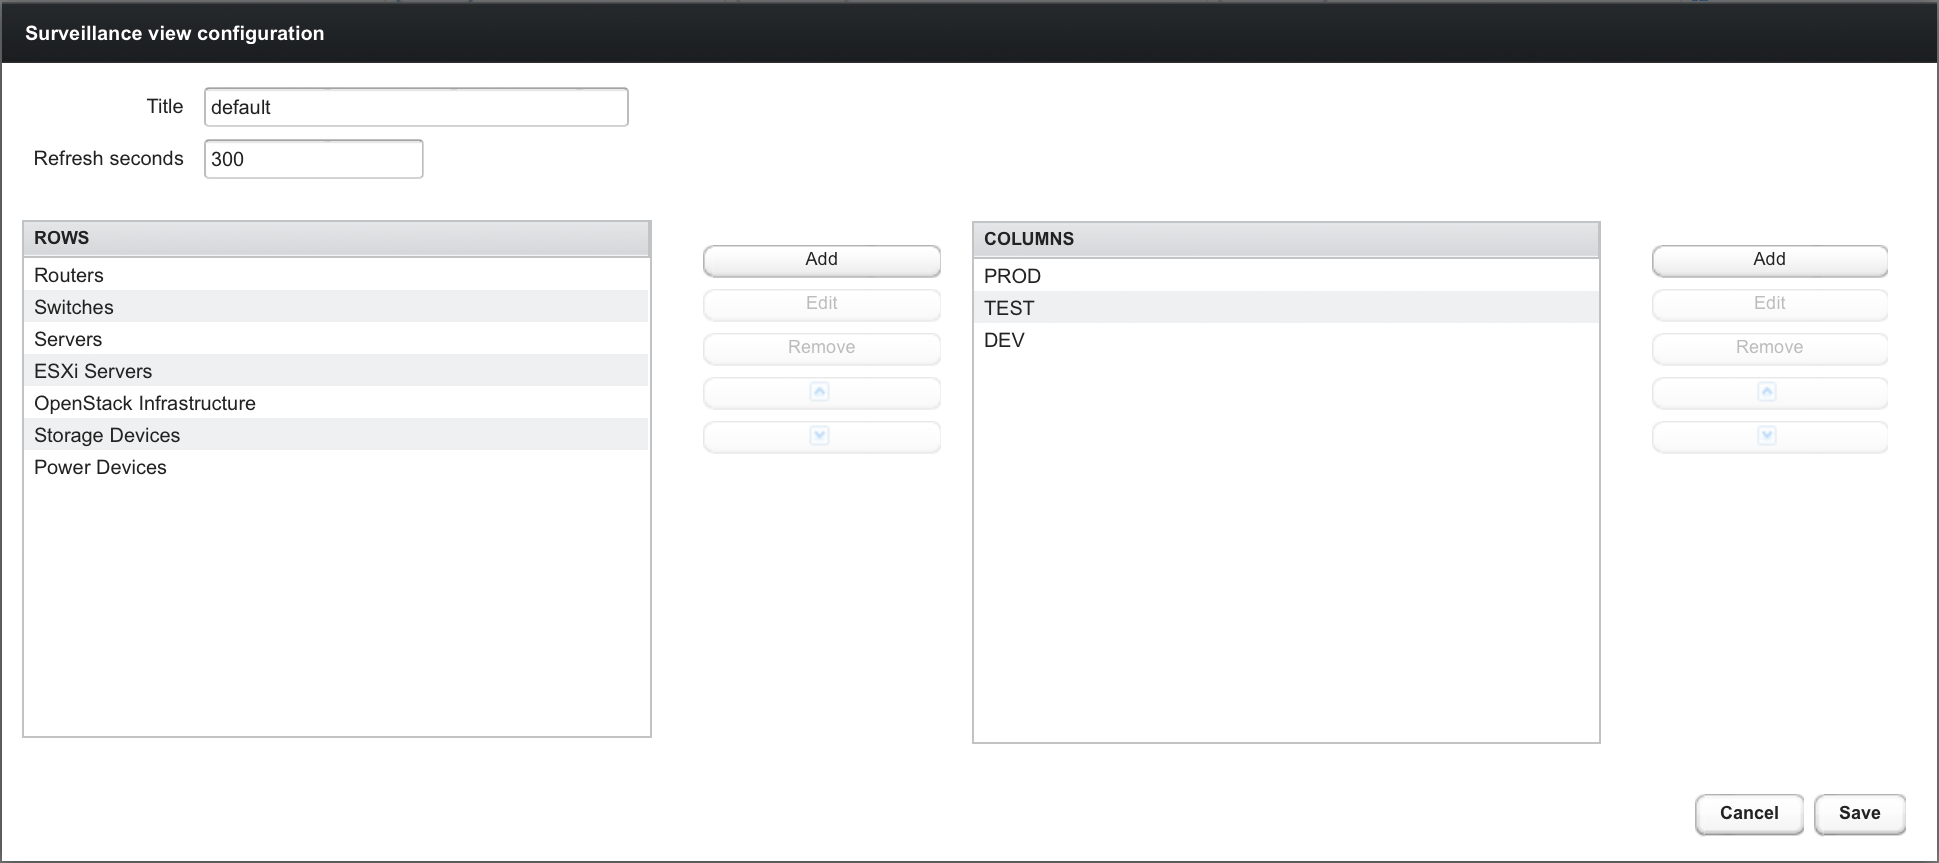
Editing row or column definitions require to choose an unique label for this entry and at least one Meridian category. When finished you can hit the Save button to persist your modified configuration or Cancel to close this dialog.
Categorizing Nodes
In order to categorize nodes in the Surveillance View, choose a node and click Edit beside Surveillance Category Memberships. Recalling from your Surveillance View, choose two categories that represent a column and a row, for example, Servers and Test, then click Add.
Creating Views for Users and Groups
You can use user and group names for Surveillance Views. When the Surveillance View page is invoked the following criteria selects the proper Surveillance View to be displayed. The first matching item wins:
-
Surveillance View name equal to the user name they used when logging into Meridian.
-
Surveillance View name equal to the user’s assigned Meridian group name
-
Surveillance View name equal to the
default-viewattribute in thesurveillance-views.xmlconfiguration file.