Dashboard
In Network Operations Centers (NOCs) an overview of issues in the network is important and often presented as dashboards. Large networks have people (operators) with different responsibilities and the dashboard should show only information for a given monitoring context. Network or Server operators need to customize or filter information on the dashboard. A dashboard as an at-a-glance overview is also often used to give an entry point for more detailed diagnosis through the information provided by the monitoring system. The Surveillance View lets you reduce the visible information by selecting rows, columns, and cells to quickly limit the amount of information to navigate through.
Components
The dashboard is built with five components:
-
Surveillance View: Lets you model a monitoring context for the dashboard.
-
Alarms: Shows unacknowledged alarms which should be escalated by an operator.
-
Notifications: Shows outstanding and unacknowledged notifications sent to engineers.
-
Node Status: Shows all ongoing network outages.
-
Resource Graph Viewer: Shows performance time series reports for performance diagnosis.
The following screenshot shows a configured dashboard and which information are displayed in the components.
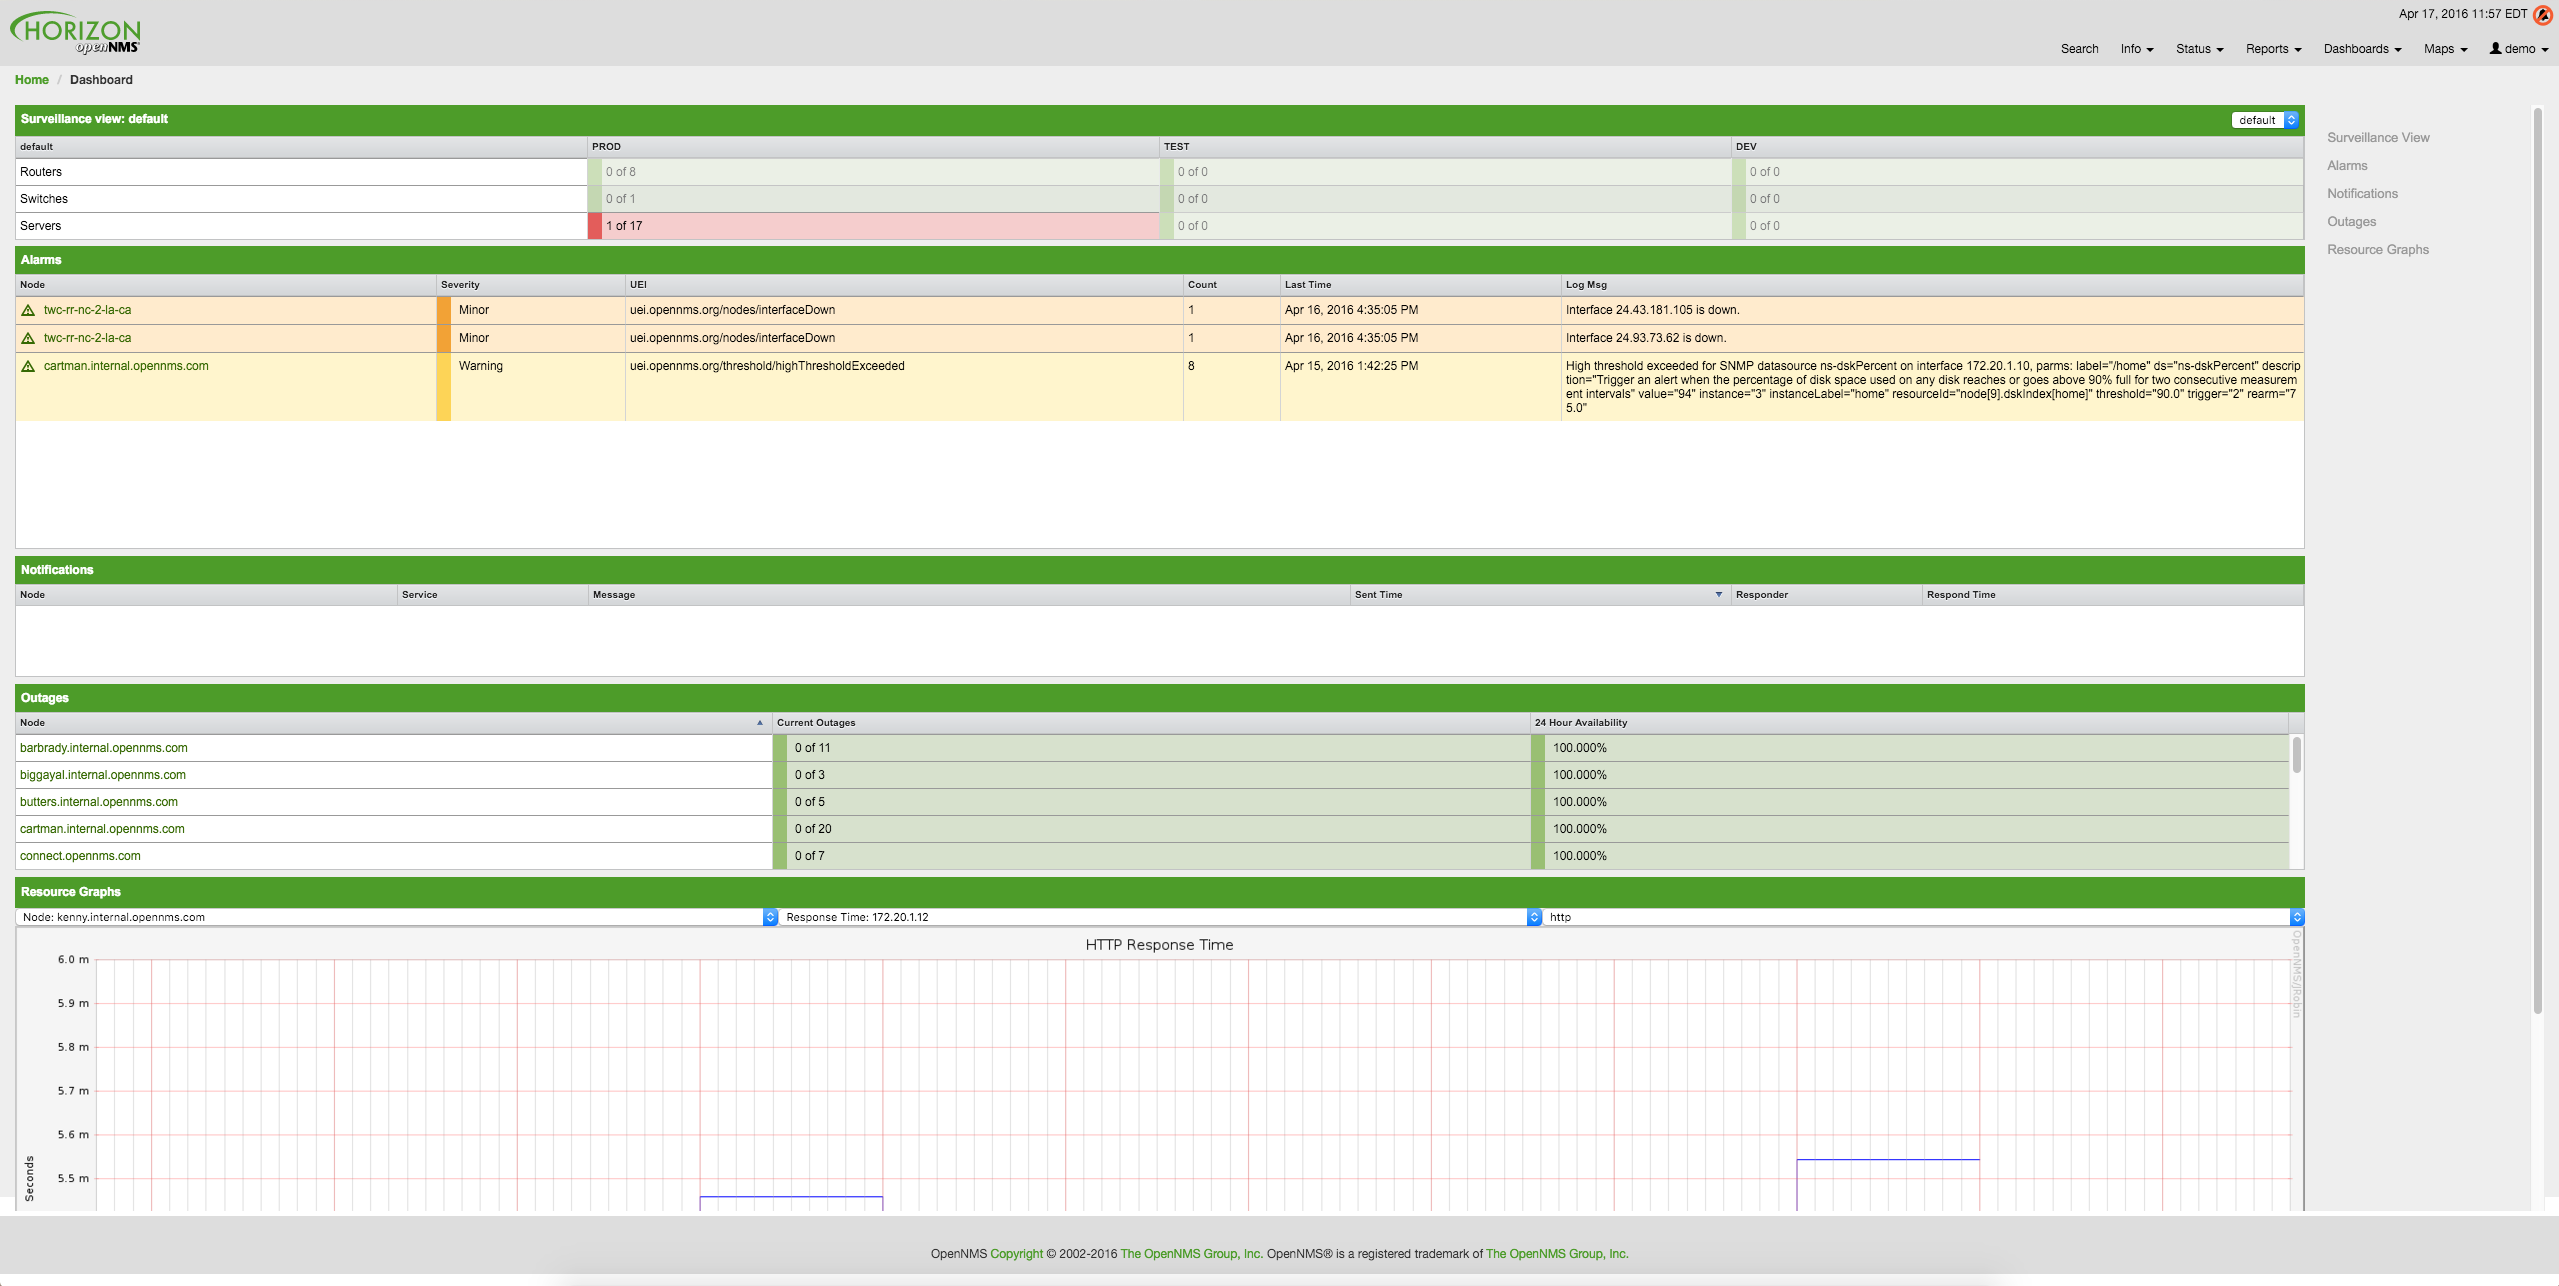
The following section describe the information shown in each component. All other components display information based on the Surveillance View.
Surveillance View
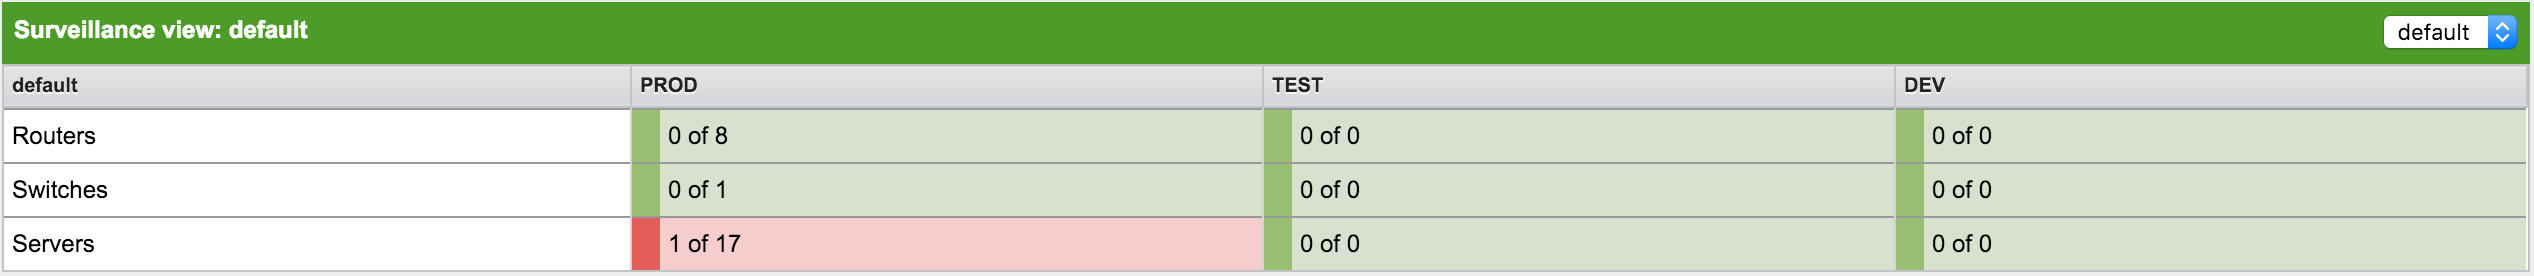
The Surveillance View has multiple functions.
-
Lets you model the monitoring context and shows service and node outages in compact matrix view.
-
Lets you limit the number of information in the dashboard by selecting rows, columns and cells.
You can select columns, rows, single cells and of course all entries in a Surveillance View. Please refer to the Surveillance View Section for details on how to configure Surveillance Views.
Alarms
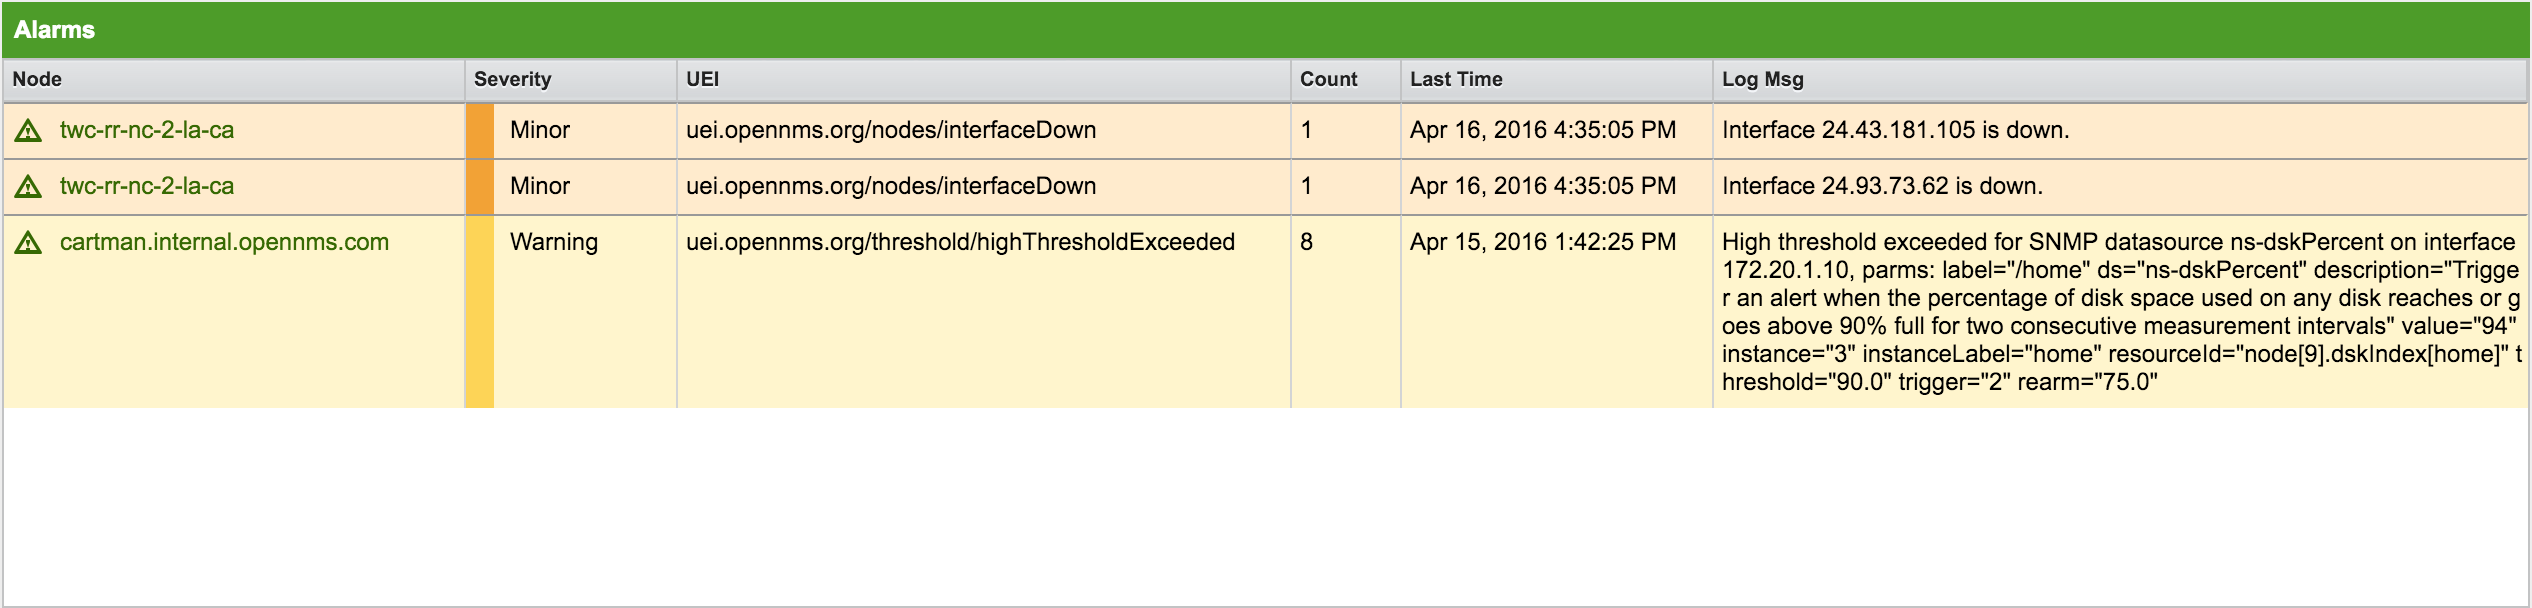
The Alarms component gives an overview about all unacknowledged alarms with a severity higher than Normal(1). Acknowledged alarms will be removed from the responsibility of the operator. The following information are shown in:
-
Node: Node label of the node associated with the alarm.
-
Severity: Severity of the alarm.
-
UEI: Shows the UEI of the alarm.
-
Count: Number of alarms deduplicated by the reduction key of the alarm.
-
Last Time: Time of the most recent alarm.
-
Log Msg: The log message from the event definition.
The Alarms component shows the most recent alarms and lets the user scroll through the last 100 alarms.
Notifications
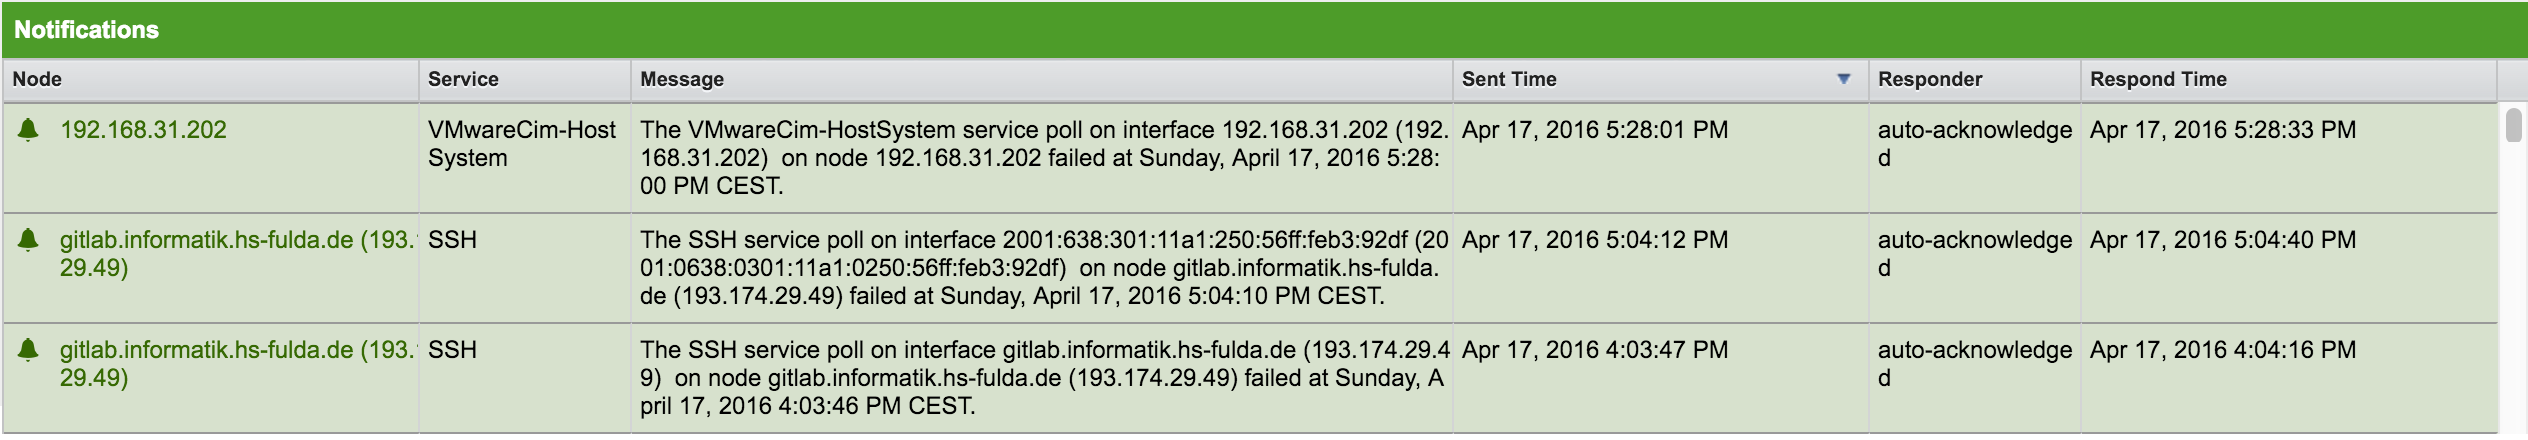
To inform people on a duty schedule notifications are used and force action to fix or reconfigure systems immediately. In Meridian it is possible to acknowledge notifications to see who is working on a specific issue. The dashboard should show outstanding notifications in the NOC to provide an overview and give the possibility for intervention.
-
Node: Label of the node associated with the notification.
-
Service: Name of the service associated with the notification.
-
Message: Message associated with the notification.
-
Sent Time: Time when the notification was sent.
-
Responder: User name who acknowledged the notification.
-
Response Time: Time when the user acknowledged the notification.
The Notifications component shows the most recent unacknowledged notifications and lets the user scroll through the last 100 notifications.
Node Status
An acknowledged alarm doesn’t mean necessarily the outage is solved. To give an overview information about ongoing Outages in the network, the dashboard shows an outage list in the Node Status component.
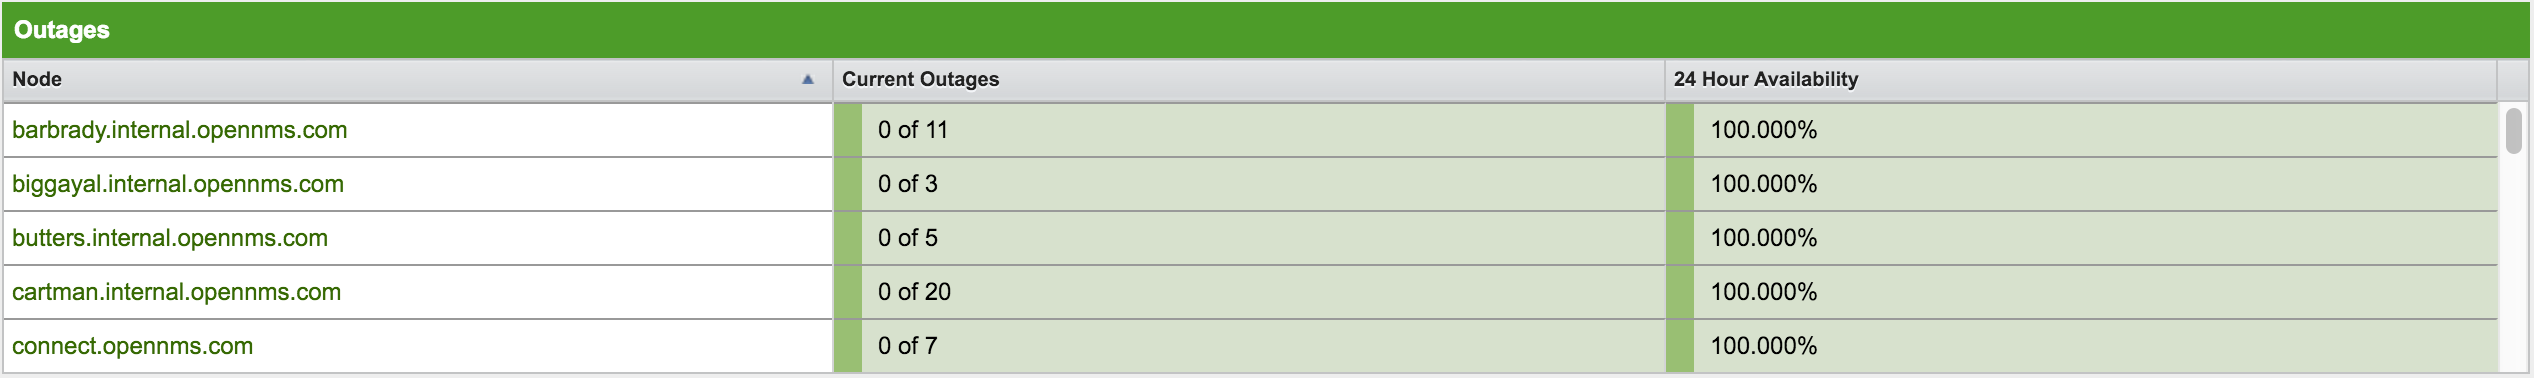
-
Node: Label of the monitored node with ongoing outages.
-
Current Outages: Number of services on the node with outages out of the total number of monitored services; for example, "3 of 3 services are affected".
-
24 Hour Availability: Availability of all services provided by the node calculated by the last 24 hours.
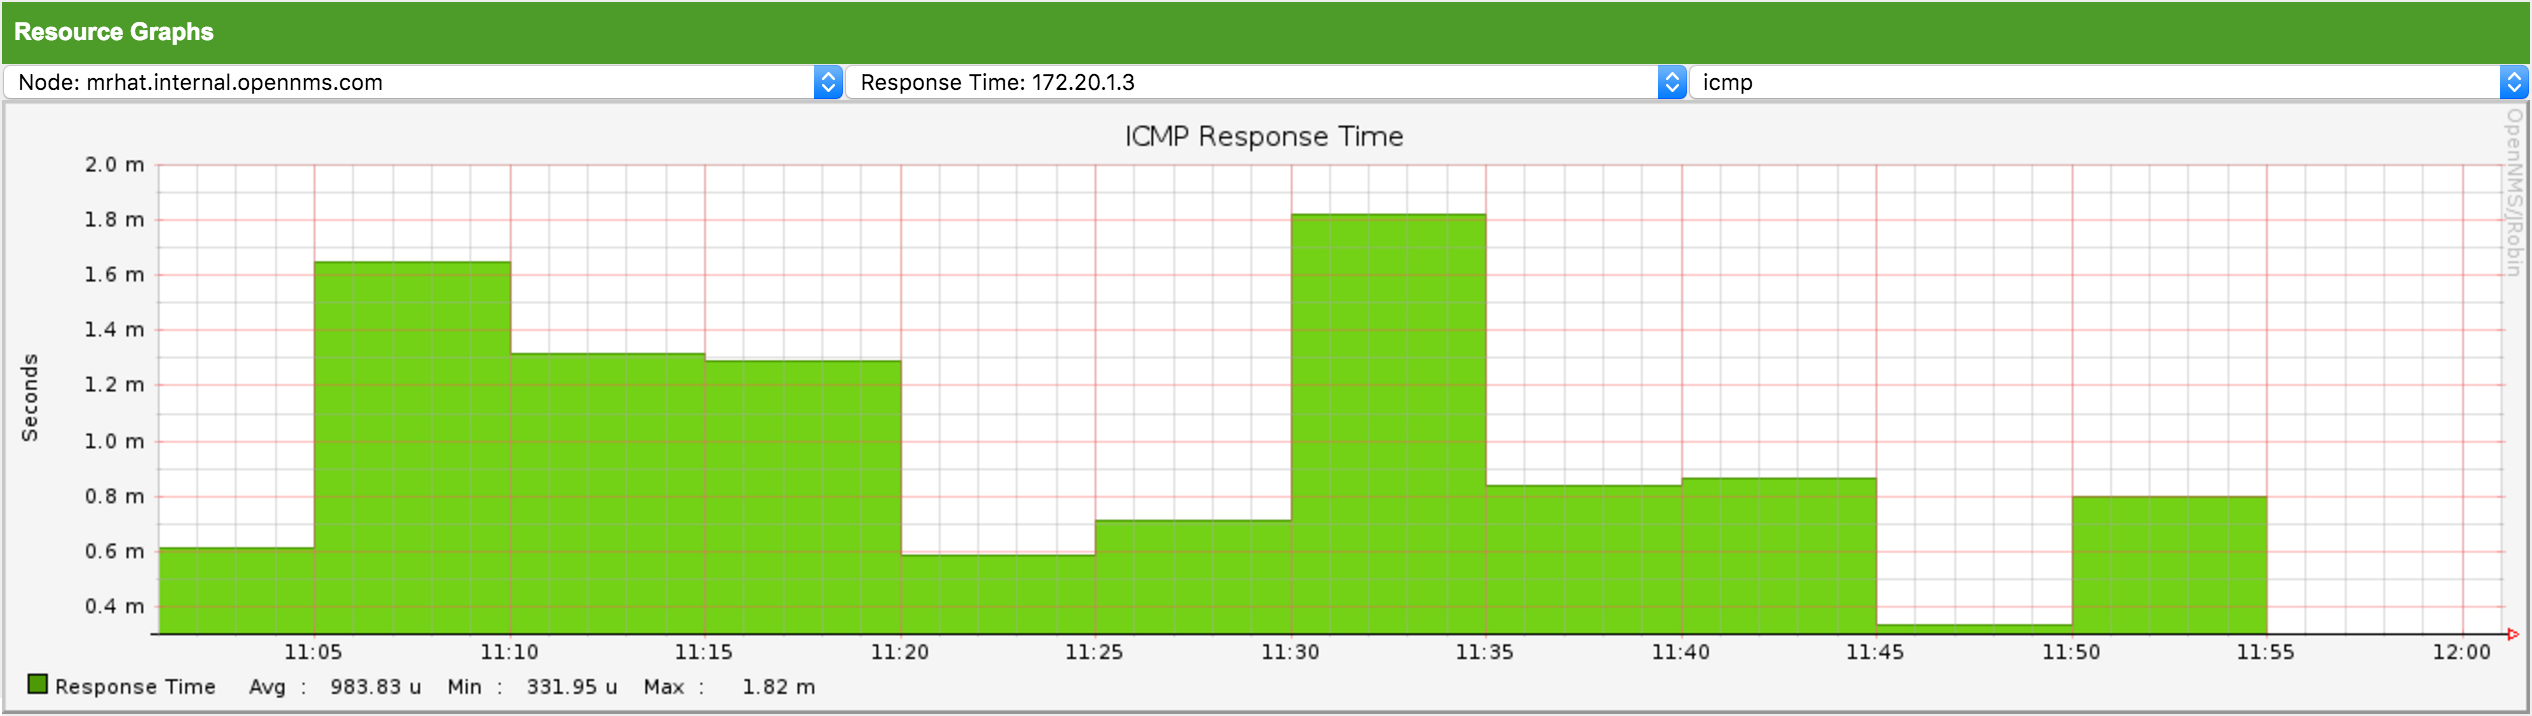
Resource Graph Viewer
The Resource Graph Viewer lets you navigate to time series data reports to give a quick entry point to diagnose performance issues. This viewer filters nodes based on the Surveillance View context and shows one graph report at a time. It lets you navigate sequentially through resource graphs provided by nodes filtered by the Surveillance View context and selection and shows one graph report at a time.
Advanced configuration
The Surveillance View component lets you model multiple views for different monitoring contexts. It gives the possibility to create special view as example for network operators or server operators. The dashboard shows only one configured Surveillance View. To give different users the possibility using their Surveillance View fitting there requirements it is possible to map a logged in user to a given Surveillance View used in the dashboard.
The selected nodes from the Surveillance View are also aware of User Restriction Filter. If you have a group of users, which should see just a subset of nodes the Surveillance View will filter nodes which are not related to the assigned user group.
The dashboard is designed to focus, and therefore also restrict, a user’s view to devices of their interest. To do this, a new role was added that can be assigned to a user that restricts them to viewing only the dashboard if that is intended.
Using the Dashboard role
The following example illustrates how this dashboard role can be used.
For instance the user drv4doe is assigned the dashboard role.
So, when logging in as drv4doe, the user is taking directly to the dashboard page and is presented with a custom dashboard based on the drv4doe Surveillance View definition.
Step 1: Create an user
The following example assigns a dashboard to the user "drv4doe" (a router and switch jockey) and restricts the user for navigation to any other link in the Meridian WebUI.
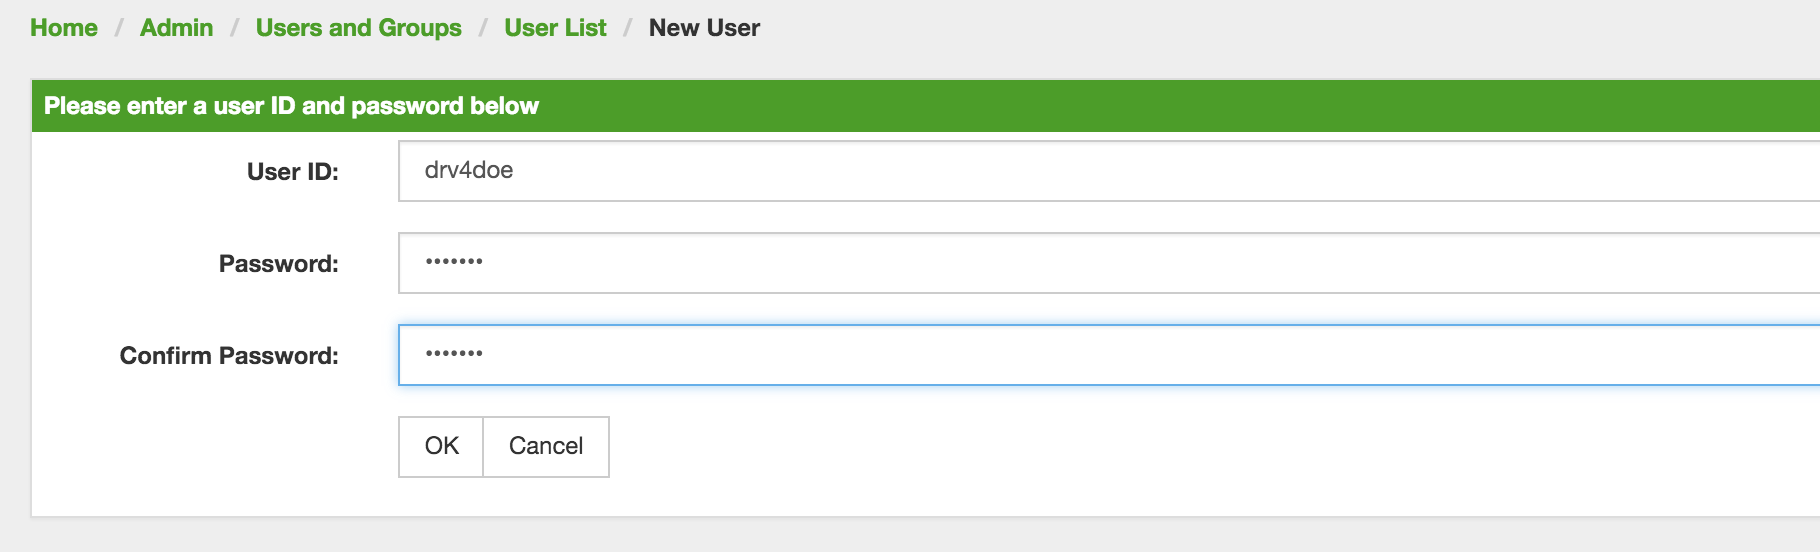
drv4doe using the Meridian WebUIStep 2: Change Security Roles
Now, add the ROLE_PROVISION role to the user through the WebUI or by manually editing the users.xml file in the ${OPENNMS_HOME}/etc directory for the user drv4doe.
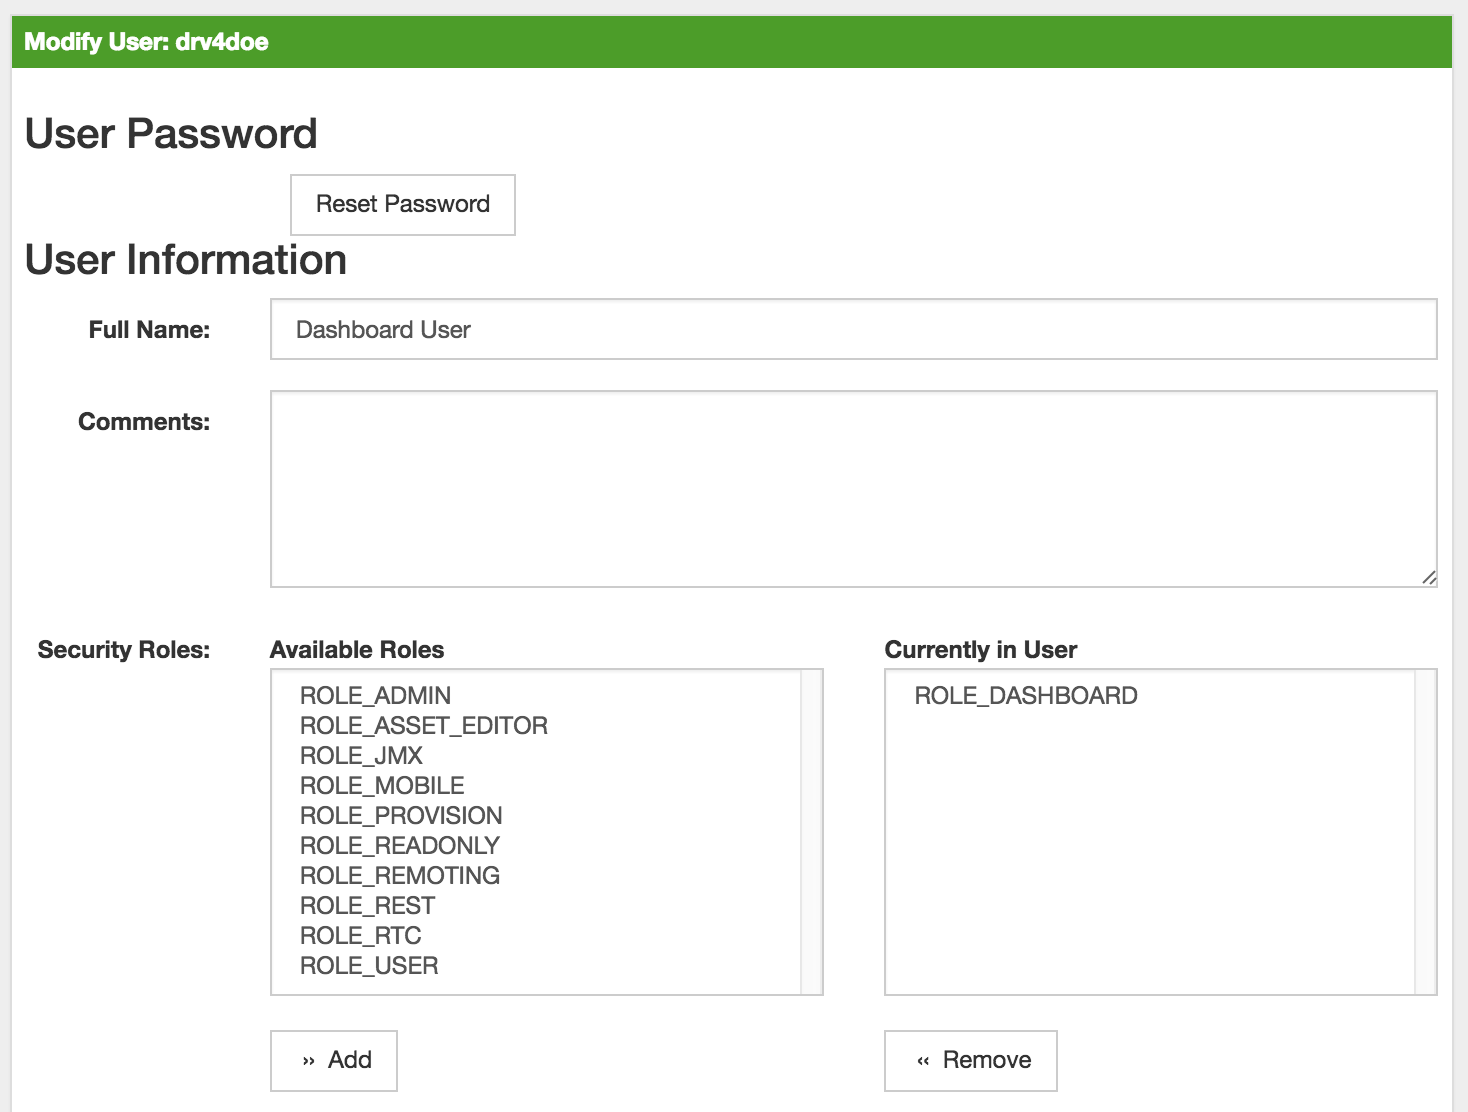
drv4doe using the Meridian WebUI<user>
<user-id>drv4doe</user-id>
<full-name>dashboard User</full-name>
<password salt="true">6FOip6hgZsUwDhdzdPUVV5UhkSxdbZTlq8M5LXWG5586eDPa7BFizirjXEfV/srK</password>
<role>ROLE_DASHBOARD</role>
</user>Step 3: Define Surveillance View
Edit the ${OPENNMS_HOME}/etc/surveillance-view.xml file to add a definition for the user drv4doe, which you created in step 1.
<?xml version="1.0" encoding="UTF-8"?>
<surveillance-view-configuration
  xmlns:this="http://www.opennms.org/xsd/config/surveillance-views"
  xmlns:xsi="http://www.w3.org/2001/XMLSchema-instance"
  xsi:schemaLocation="http://www.opennms.org/xsd/config/surveillance-views http://www.opennms.org/xsd/config/surveillance-views.xsd"
  default-view="default" >
  <views >
    <view name="drv4doe" refresh-seconds="300" >
      <rows>
        <row-def label="Servers" >
          <category name="Servers"/>
        </row-def>
      </rows>
      <columns>
        <column-def label="PROD" >
          <category name="Production" />
        </column-def>
        <column-def label="TEST" >
          <category name="Test" />
        </column-def>
      </columns>
    </view>
    <!-- default view here -->
    <view name="default" refresh-seconds="300" >
      <rows>
        <row-def label="Routers" >
          <category name="Routers"/>
        </row-def>
        <row-def label="Switches" >
          <category name="Switches" />
        </row-def>
        <row-def label="Servers" >
          <category name="Servers" />
        </row-def>
      </rows>
      <columns>
        <column-def label="PROD" >
          <category name="Production" />
        </column-def>
        <column-def label="TEST" >
          <category name="Test" />
        </column-def>
        <column-def label="DEV" >
          <category name="Development" />
        </column-def>
      </columns>
    </view>
  </views>
</surveillance-view-configuration>
This configuration and proper assignment of node tags will produce a default dashboard for all users, other than drv4doe.
You can hide the upper navigation on any page by specifying ?quiet=true; adding it to the end of the Meridian URL.
This is useful when viewing the dashboard on a large monitor or TV screen for office-wide viewing.
|
However, when logging in as drv4doe, the user is taking directly to the dashboard page and is presented with a dashboard based on the custom Surveillance View definition.
The drv4doe user is not allowed to navigate to URLs other than the dashboard.jsp URL.
Doing so will result in an Access Denied error.
|
Anonymous dashboards
You can modify the configuration files for the security framework to give you access to one or more dashboards without logging in.
At the end you’ll be able to point a browser at a special URL like http://hostname/opennms/dashboard1 or http://hostname/opennms/dashboard2 and see a dashboard without any authentication.
First, configure surveillance views and create dashboard users as above.
For example, make two dashboards and two users called dashboard1 and dashboard2.
Test that you can log in as each of the new users and see the correct dashboard.
Now create some aliases you can use to distinguish between dashboards.
In ${OPENNMS_HOME}/jetty-webapps/opennms/WEB-INF, edit web.xml.
Just before the first <servlet-mapping> tag, add the following servlet entries:
    <servlet>
        <servlet-name>dashboard1</servlet-name>
        <jsp-file>/dashboard.jsp</jsp-file>
    </servlet>

    <servlet>
        <servlet-name>dashboard2</servlet-name>
        <jsp-file>/dashboard.jsp</jsp-file>
    </servlet>
Just before the first <error-page> tag, add the following servlet-mapping entries:
    <servlet-mapping>
        <servlet-name>dashboard1</servlet-name>
        <url-pattern>/dashboard1</url-pattern>
    </servlet-mapping>

    <servlet-mapping>
        <servlet-name>dashboard2</servlet-name>
        <url-pattern>/dashboard2</url-pattern>
    </servlet-mapping>
After the last <filter-mapping> tag, add the following filter-mapping entries:
  <filter-mapping>
    <filter-name>AddRefreshHeader-120</filter-name>
    <url-pattern>/dashboard.jsp</url-pattern>
  </filter-mapping>
  <filter-mapping>
    <filter-name>AddRefreshHeader-120</filter-name>
    <url-pattern>/dashboard1</url-pattern>
  </filter-mapping>
  <filter-mapping>
    <filter-name>AddRefreshHeader-120</filter-name>
    <url-pattern>/dashboard2</url-pattern>
  </filter-mapping>
Next edit applicationContext-acegi-security.xml to enable anonymous authentication for the /dashboard1 and /dashboard2 aliases.
Near the top of the file, find <bean id="filterChainProxy" …>.
Below the entry for /rss.jsp*, add an entry for each of the dashboard aliases:
  <bean id="filterChainProxy" class="org.acegisecurity.util.FilterChainProxy">
    <property name="filterInvocationDefinitionSource">
      <value>
        CONVERT_URL_TO_LOWERCASE_BEFORE_COMPARISON
        PATTERN_TYPE_APACHE_ANT
        /rss.jsp*=httpSessionContextIntegrationFilter,logoutFilter,authenticationProcessingFilter,basicProcessingFilter,securityContextHolderAwareRequestFilter,anonymousProcessingFilter,basicExceptionTranslationFilter,filterInvocationInterceptor
        /dashboard1*=httpSessionContextIntegrationFilter,logoutFilter,securityContextHolderAwareRequestFilter,dash1AnonymousProcessingFilter,filterInvocationInterceptor
        /dashboard2*=httpSessionContextIntegrationFilter,logoutFilter,securityContextHolderAwareRequestFilter,dash2AnonymousProcessingFilter,filterInvocationInterceptor
        /**=httpSessionContextIntegrationFilter,logoutFilter,authenticationProcessingFilter,basicProcessingFilter,securityContextHolderAwareRequestFilter,anonymousProcessingFilter,exceptionTranslationFilter,filterInvocationInterceptor

...
About halfway through the file, look for <bean id="filterInvocationInterceptor" …>.
Below the entry for /dashboard.jsp, add an entry for each of the aliases:
  <bean id="filterInvocationInterceptor" class="org.acegisecurity.intercept.web.FilterSecurityInterceptor">

...

        /frontpage.htm=ROLE_USER,ROLE_DASHBOARD
        /dashboard.jsp=ROLE_USER,ROLE_DASHBOARD
        /dashboard1=ROLE_USER,ROLE_DASHBOARD
        /dashboard2=ROLE_USER,ROLE_DASHBOARD
        /gwt.js=ROLE_USER,ROLE_DASHBOARD

...
Finally, near the bottom of the page, add a new instance of AnonymousProcessingFilter for each alias.
  <!-- Set the anonymous username to dashboard1 so the dashboard page
       can match it to a surveillance view of the same name. -->
  <bean id="dash1AnonymousProcessingFilter" class="org.acegisecurity.providers.anonymous.AnonymousProcessingFilter">
    <property name="key"><value>foobar</value></property>
    <property name="userAttribute"><value>dashboard1,ROLE_DASHBOARD</value></property>
  </bean>

  <bean id="dash2AnonymousProcessingFilter" class="org.acegisecurity.providers.anonymous.AnonymousProcessingFilter">
    <property name="key"><value>foobar</value></property>
    <property name="userAttribute"><value>dashboard2,ROLE_DASHBOARD</value></property>
  </bean>
Restart Meridian and you should bring up a dashboard at http://hostname/opennms/dashboard1 without logging in.
| There’s no way to switch dashboards without closing the browser (or deleting the JSESSIONID session cookie). |
If you accidentally click a link that requires full user privileges (for example, Node List), you’ll be given a login form.
Once you receive the login form, you cannot return to the dashboard without restarting the browser.
If this problem bothers you, you can set ROLE_USER in addition to ROLE_DASHBOARD in your userAttribute property.
However, setting this role will give full user access to anonymous browsers.
|