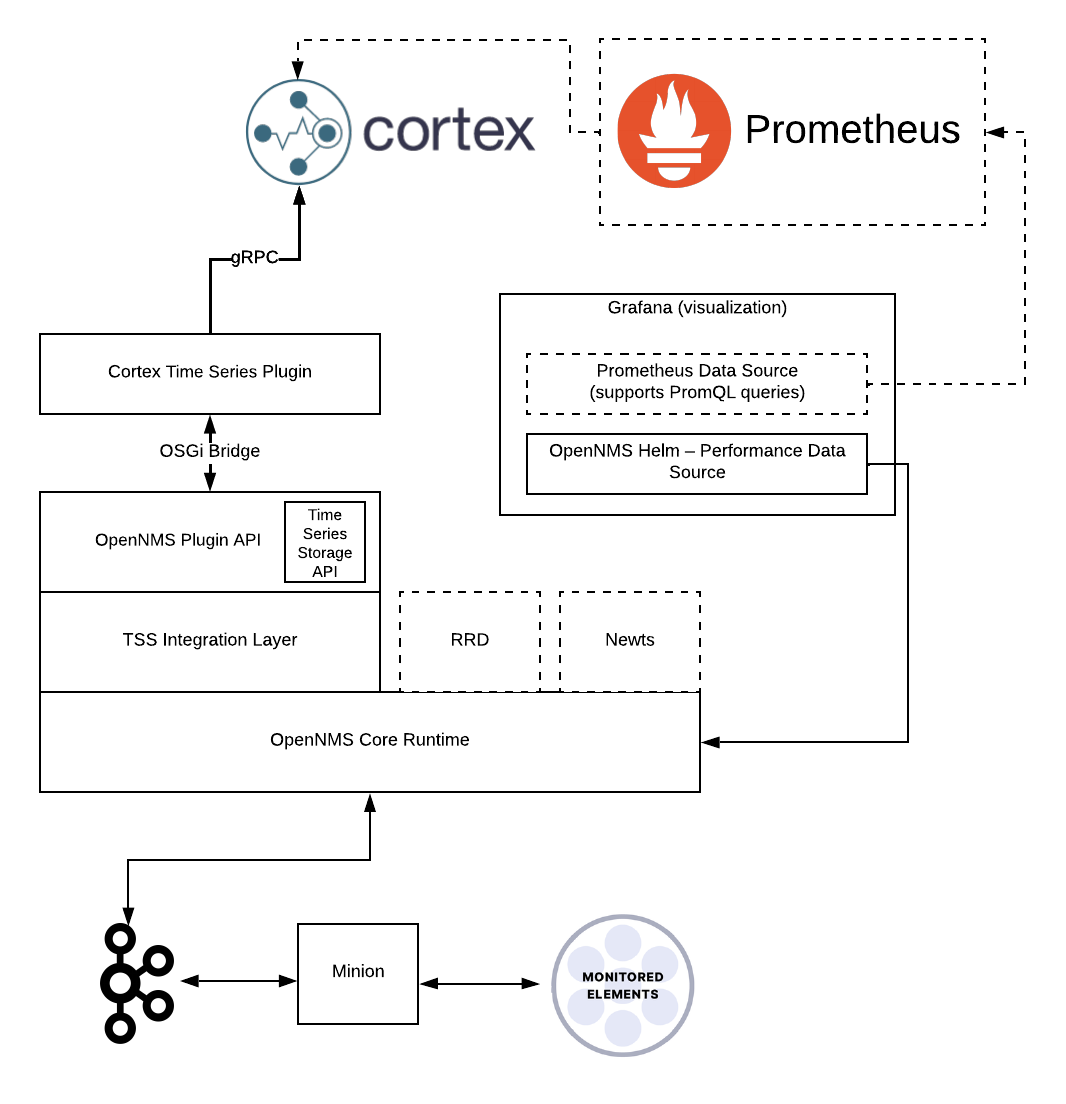
Prometheus RemoteWrite Plugin
The Prometheus RemoteWrite plugin enables Meridian to persist time series performance and latency data to any Prometheus remote-write compatible time series store (for example, VictoriaMetrics, Mimir, or Cortex). The plugin uses the time series storage integration layer to convert metrics to a Prometheus model and delegate writes and reads to the configured time series store. It also lets you visualize graphs from the time series store in the OpenNMS plugin for Grafana through the OpenNMS performance data source or the Prometheus data source.
Requirements
You must have the following before you start to use the Prometheus RemoteWrite plugin:
-
A Prometheus remote-write compatible time series store, such as VictoriaMetrics, Mimir, or Cortex 1.10.0+
Deployment
To use the Prometheus RemoteWrite plugin, follow these steps:
-
Start your Prometheus remote-write compatible time series store (see the VictoriaMetrics documentation, Mimir documentation, or Cortex documentation for instructions). If your aim is to get up to speed quickly in a test environment, you can use Docker Compose to deploy a minimal, standalone Cortex node.
-
Download the plugin’s
.karfile from GitHub. -
Copy the
.karfile into${OPENNMS_HOME}/deploy. -
Enable and configure time series database plugins in
${OPENNMS_HOME}/etc/opennms.properties.d/timeseries.properties:org.opennms.timeseries.strategy=integration (1) (2) org.opennms.timeseries.tin.metatags.tag.node=${node:label} (3) org.opennms.timeseries.tin.metatags.tag.location=${node:location} org.opennms.timeseries.tin.metatags.tag.geohash=${node:geohash} org.opennms.timeseries.tin.metatags.tag.ifDescr=${interface:if-description} org.opennms.timeseries.tin.metatags.tag.ifName=${interface:if-name}1 Make sure that the org.opennms.timeseries.strategyproperty is set only once so you don’t have conflicting values in multiplepropertiesfiles.2 If you are enabling the dual write plugin on an existing installation and want to keep historical metrics, do not set the org.opennms.timeseries.strategytointegrationuntil you have written enough data to expire any collected data prior to enabling the dual write feature.3 See the time series integration section for more information on defining metatags. If you are deploying to a container, instead of setting org.opennms.timeseries.strategyvia a properties file, you can set your container’s environment variables configuration to specifyOPENNMS_TIMESERIES_STRATEGY=integration. -
Configure the Prometheus RemoteWrite plugin in Meridian via the Karaf shell, or by creating or modifying
${OPENNMS_HOME}/etc/org.opennms.plugins.tss.prometheus.cfg.The
writeUrlandreadUrlproperties are required. All other properties shown here are example values to overwrite the defaults. Monitor your time series store’s performance and adjust these properties as necessary. Substitute the correct host and port for your time series store.Configure the plugin’s properties:config:edit org.opennms.plugins.tss.prometheus property-set writeUrl http://victoriametrics-host:8428/api/v1/write property-set readUrl http://victoriametrics-host:8428/prometheus/api/v1 property-set maxConcurrentHttpConnections 100 property-set writeTimeoutInMs 1000 property-set readTimeoutInMs 1000 property-set metricCacheSize 1000 property-set externalTagsCacheSize 1000 property-set bulkheadMaxWaitDurationInMs 9223372036854775807 config:updateCreate or modify the${OPENNMS_HOME}/etc/org.opennms.plugins.tss.prometheus.cfgfile:writeUrl=http://victoriametrics-host:8428/api/v1/write readUrl=http://victoriametrics-host:8428/prometheus/api/v1 maxConcurrentHttpConnections=100 writeTimeoutInMs=1000 readTimeoutInMs=1000 metricCacheSize=1000 externalTagsCacheSize=1000 bulkheadMaxWaitDurationInMs=9223372036854775807The URL paths shown above are for VictoriaMetrics single-node. For Cortex, use writeUrl=http://cortex-host:9009/api/prom/pushandreadUrl=http://cortex-host:9009/prometheus/api/v1. For Mimir, follow the Mimir documentation for its remote-write endpoint. -
Edit or create
${OPENNMS_HOME}/etc/featuresBoot.d/prometheus-remotewrite.bootto configure the plugin to remain installed after Meridian restarts:opennms-plugins-prometheus-remotewrite wait-for-kar=opennms-prometheus-remotewrite-plugin -
Restart the Meridian service.
Validation
After the first collection cycle (five minutes by default), query the time series store to confirm that metrics are arriving:
curl -s 'http://victoriametrics-host:8428/api/v1/series' \
  --data-urlencode 'match[]={resourceId!=""}' \
  --data-urlencode 'start=0' | jq '.data | length'
A non-zero result confirms the plugin is writing successfully.
If the count is 0, check ${OPENNMS_HOME}/logs/karaf.log for errors (filter for cortex, prometheus, or tss).