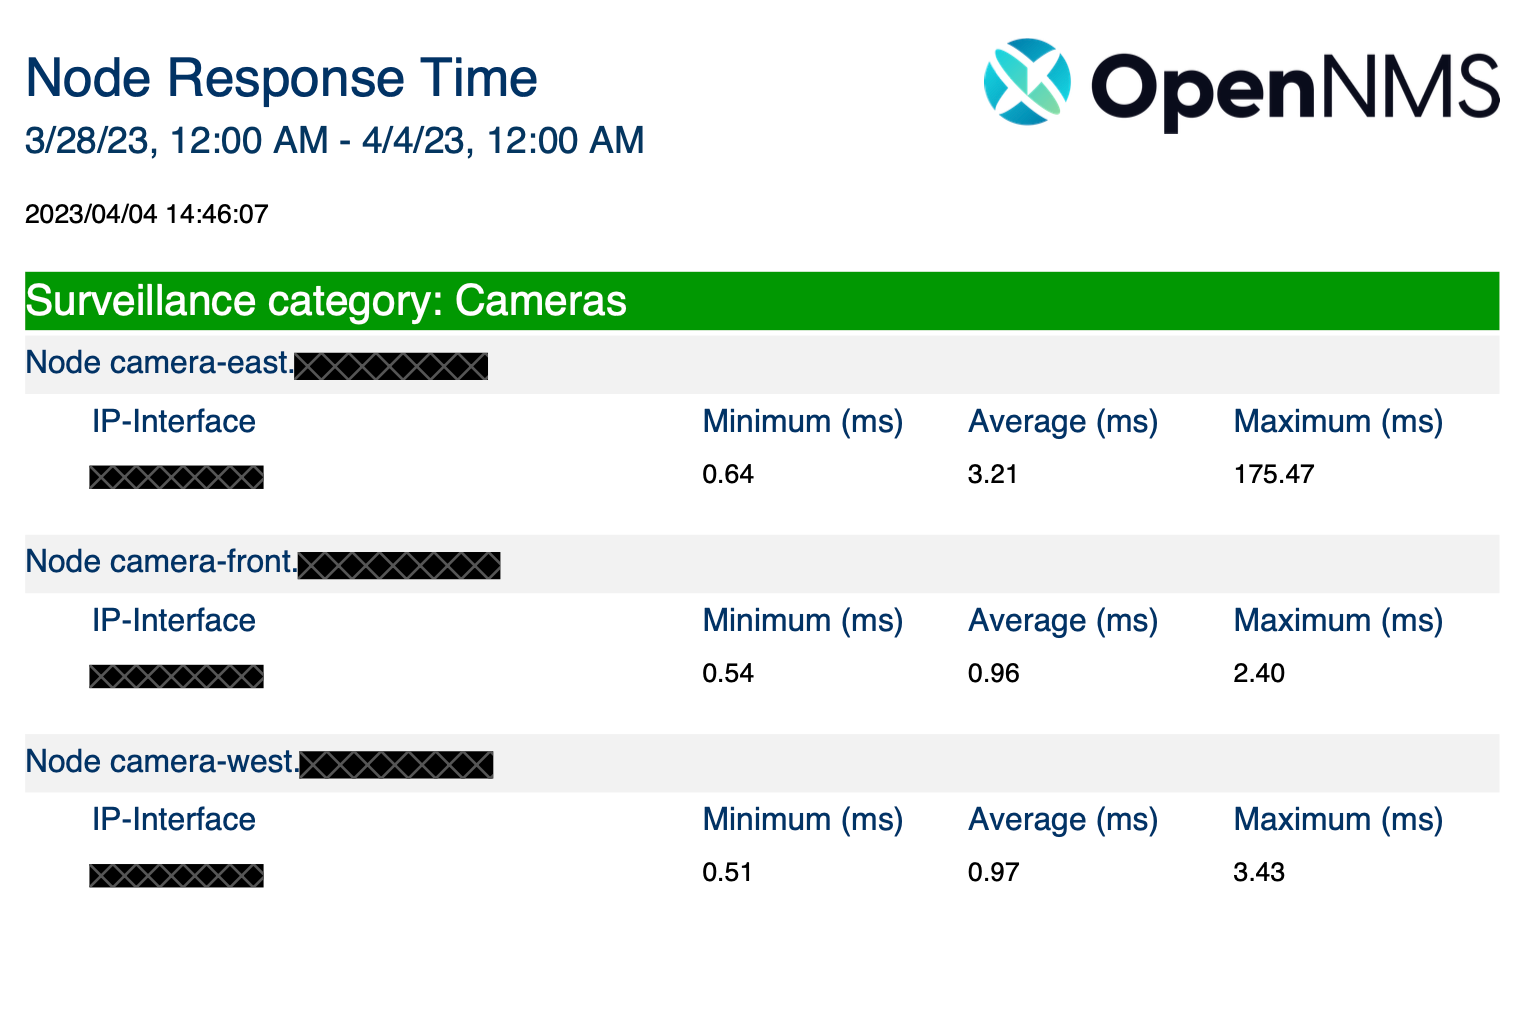
Node Response Time Report
This report lists the response times by nodes, filtered by specified node tags.
This report has a table for each matching node tag that lists the devices, and a row for each IP interface with the minimum, average, and maximum ICMP latency of the period of the report:

You can customize this report with a company logo (approximately 195px by 50px) in the header and footer.
Parameters
| Field | Description | Default Value |
|---|---|---|
Surveillance Category |
One or more node tags to include in the report. To select multiple tags, use wildcards as described below. If no tags match the entered string, the report will have no data. |
% |
Start Date |
The starting date for the data contained in this report. |
7 days before today |
End Date |
The end date for the data contained in this report.
If the end date is later than the |
Today |