Flows
Flows are summaries of network traffic sent by network devices (switches, routers, and so on). This information includes, but is not limited to, source and destination addresses, source and destination ports, octet count, and duration of activity. Collecting and analyzing flows data provides a picture of network usage and helps to diagnose issues. Persisting flows for long-term storage can aid in forensic analysis.
View flows data
By default, OpenNMS Cloud/Lōkahi displays the following flows data:
-
Node reachability
-
Top nodes
-
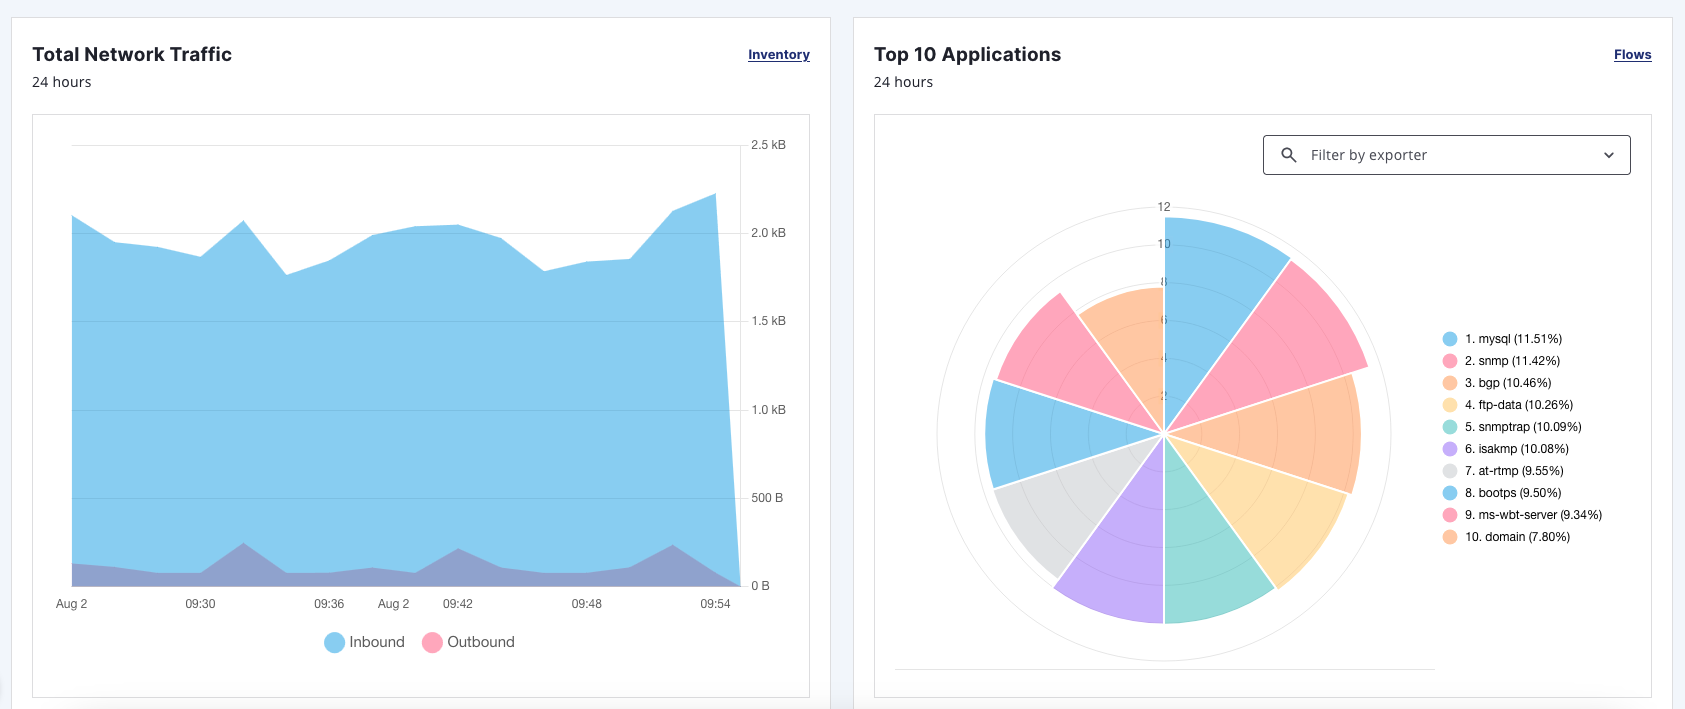
Total network traffic
-
Top 10 applications
You can see visualizations of this flows data on the Insights Dashboard and on the Flows page.
For more information on data visualization, see Visualizations.
Configure flows data display
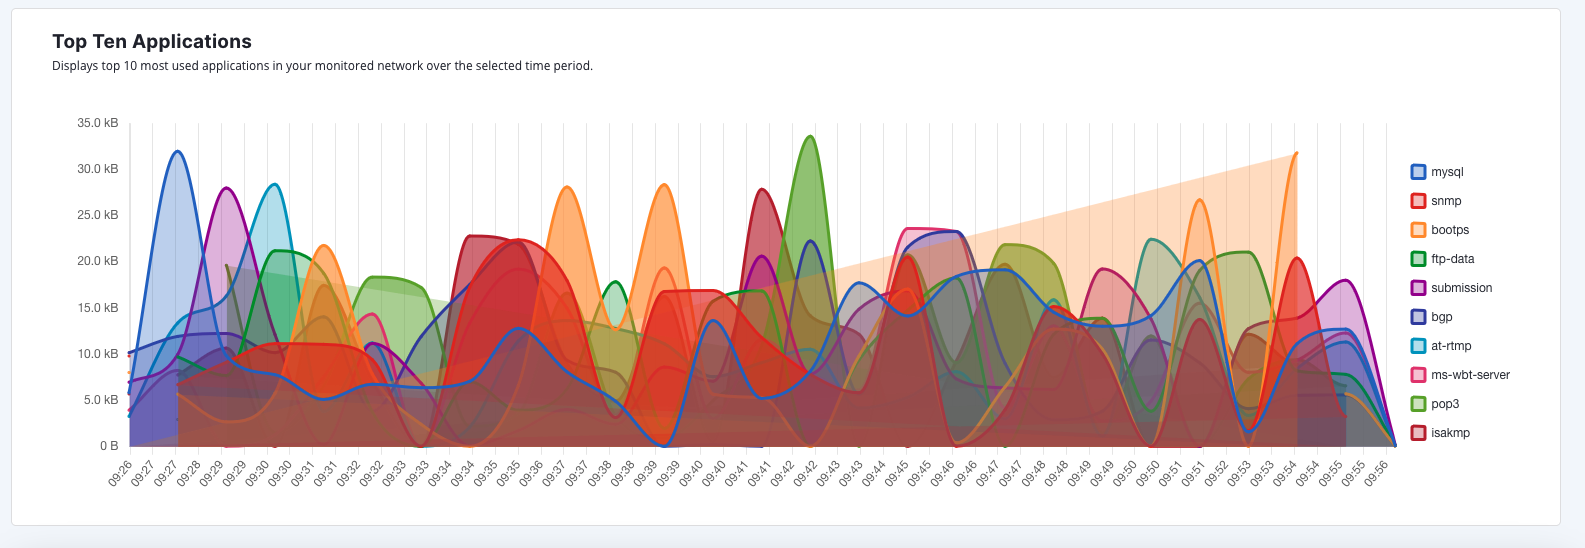
By default, the Flows page displays graphs that show the top 10 applications for the network devices that you are monitoring. You can filter items like time period and type of traffic to customize the information displayed.
Note that you can also download a PDF file of the data or refresh it by clicking the respective symbols on the page.
To configure your flows data display, follow these steps:
-
On the Insights Dashboard page, click the Flows link on the Top 10 Applications graph.
-
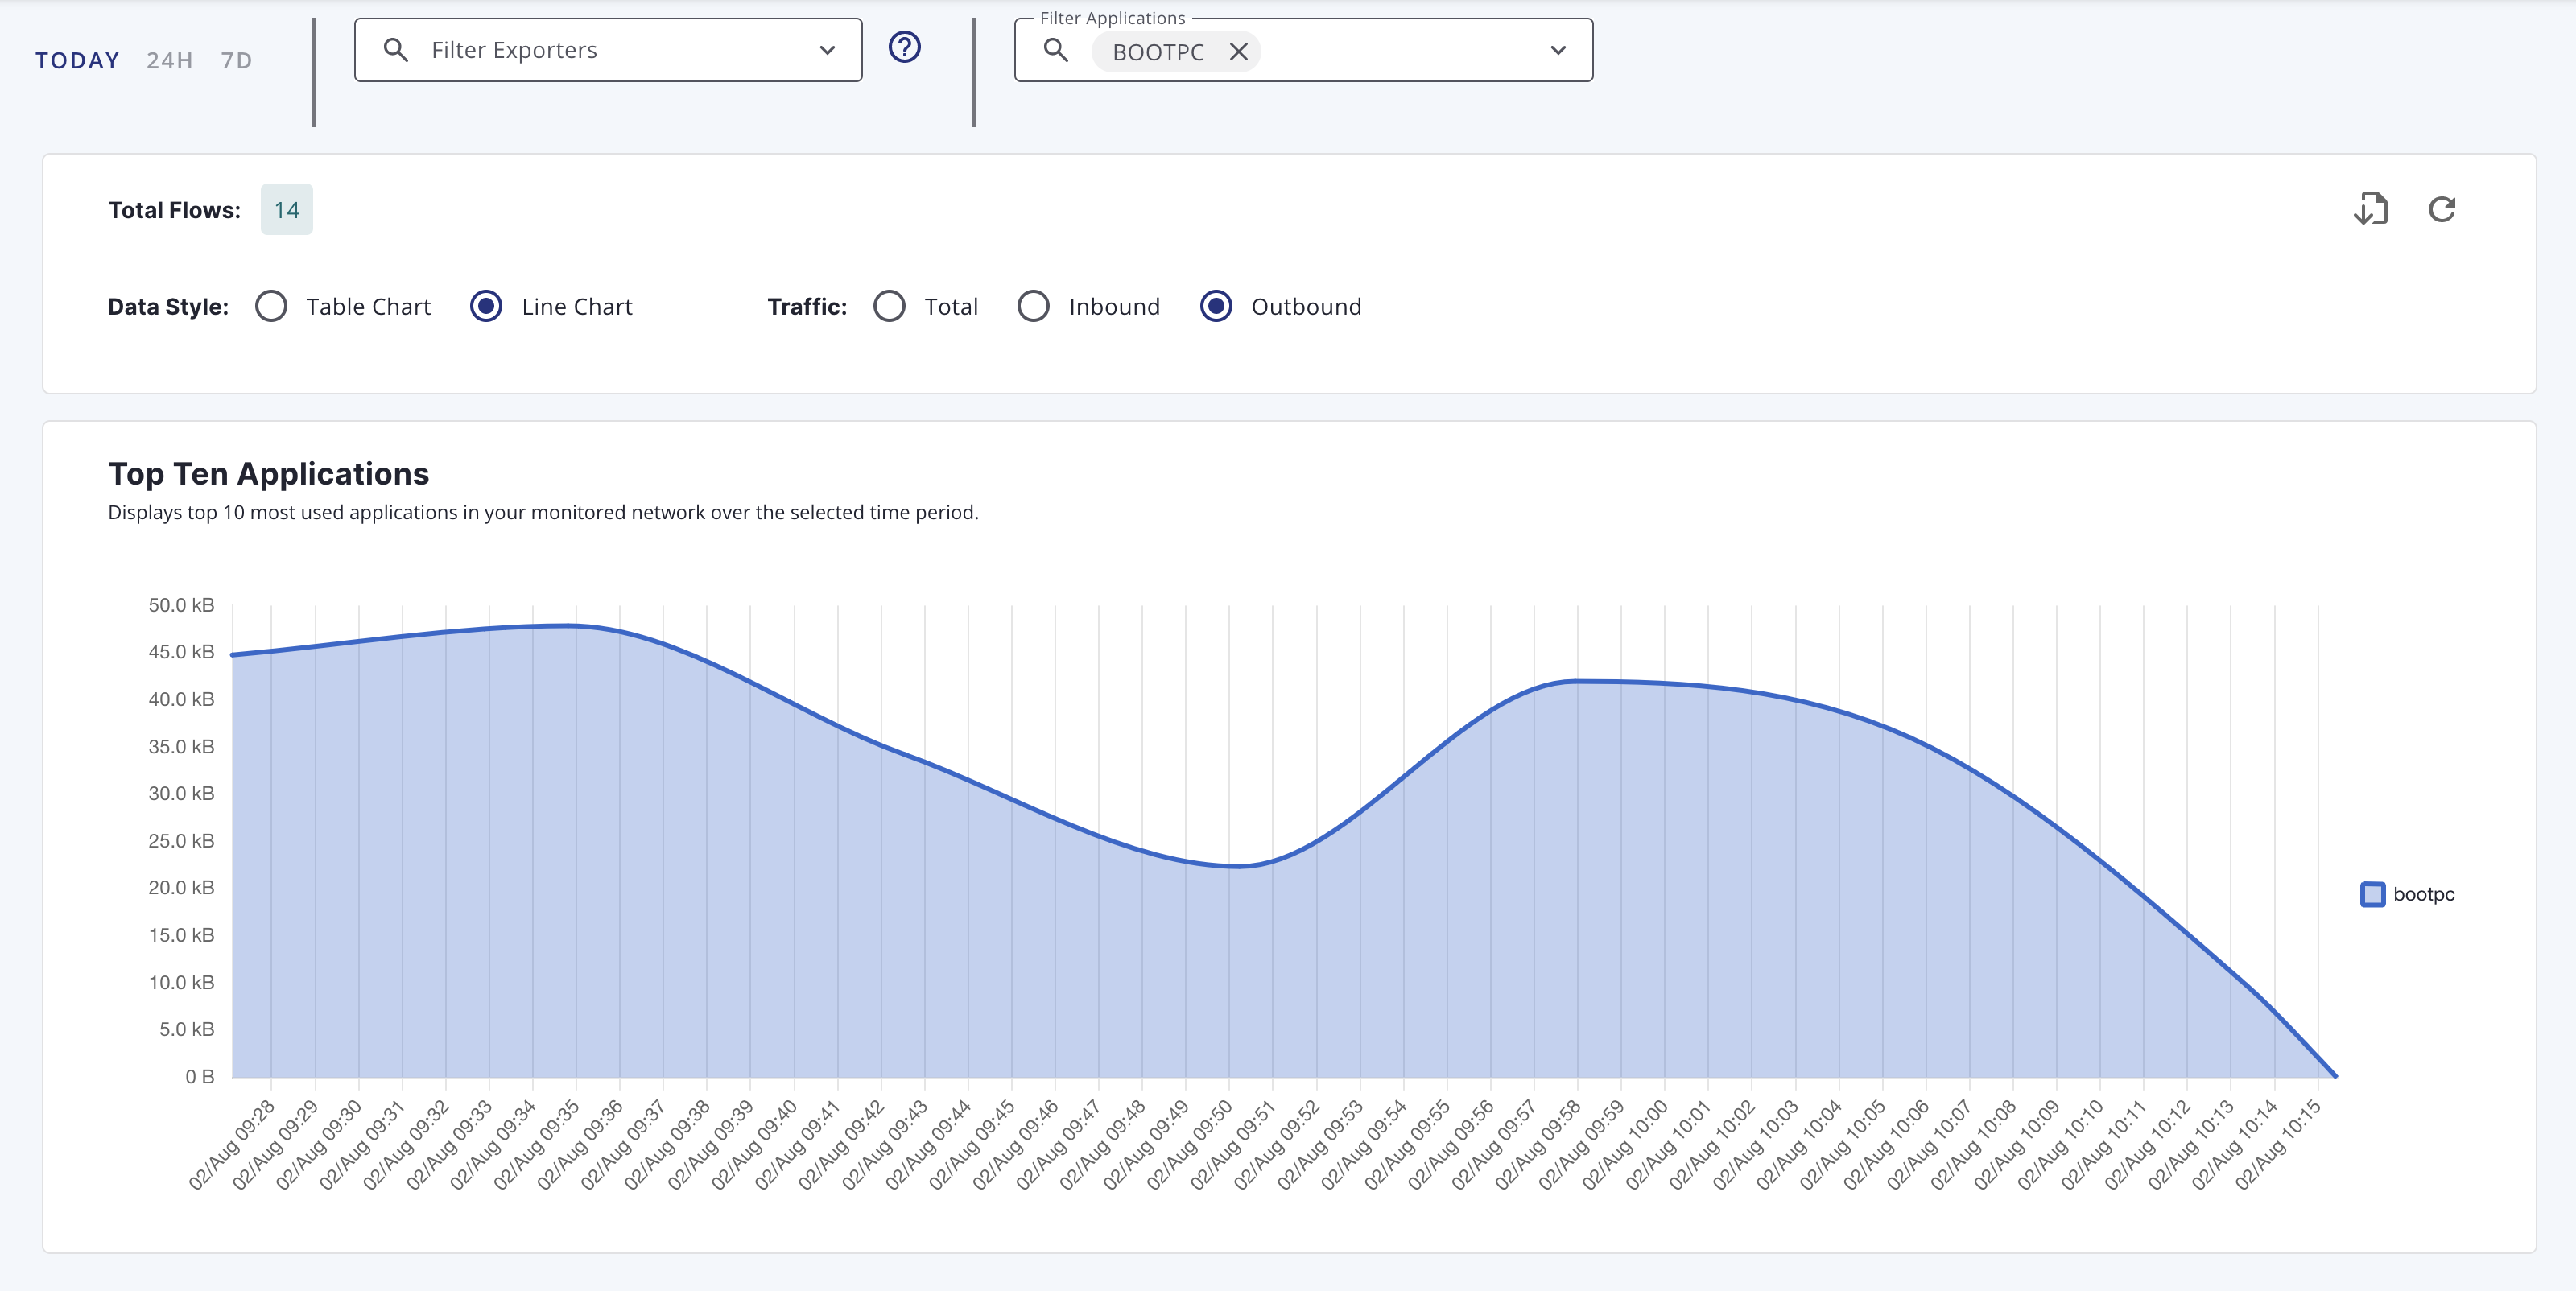
On the Flows page, specify the following information:
-
Time period (current calendar day, last 24 hours, last 7 days)
-
Exporters (devices configured to export flow reports)
-
Applications (monitored protocols)
The list of exporters and applications to filter on depends on the flows data you are collecting. -
Chart (graph) type (table or line)
-
Traffic type (total, inbound, or outbound)
-
-
Click the refresh symbol to update the display.
-
Click the download symbol to download a PDF of the flows data.
The following shows a graph filtered to display only bootpc application data:
You can also filter on the data by hovering on any point in a line graph or table graph. A pop up appears summarizing the data for the selected time.
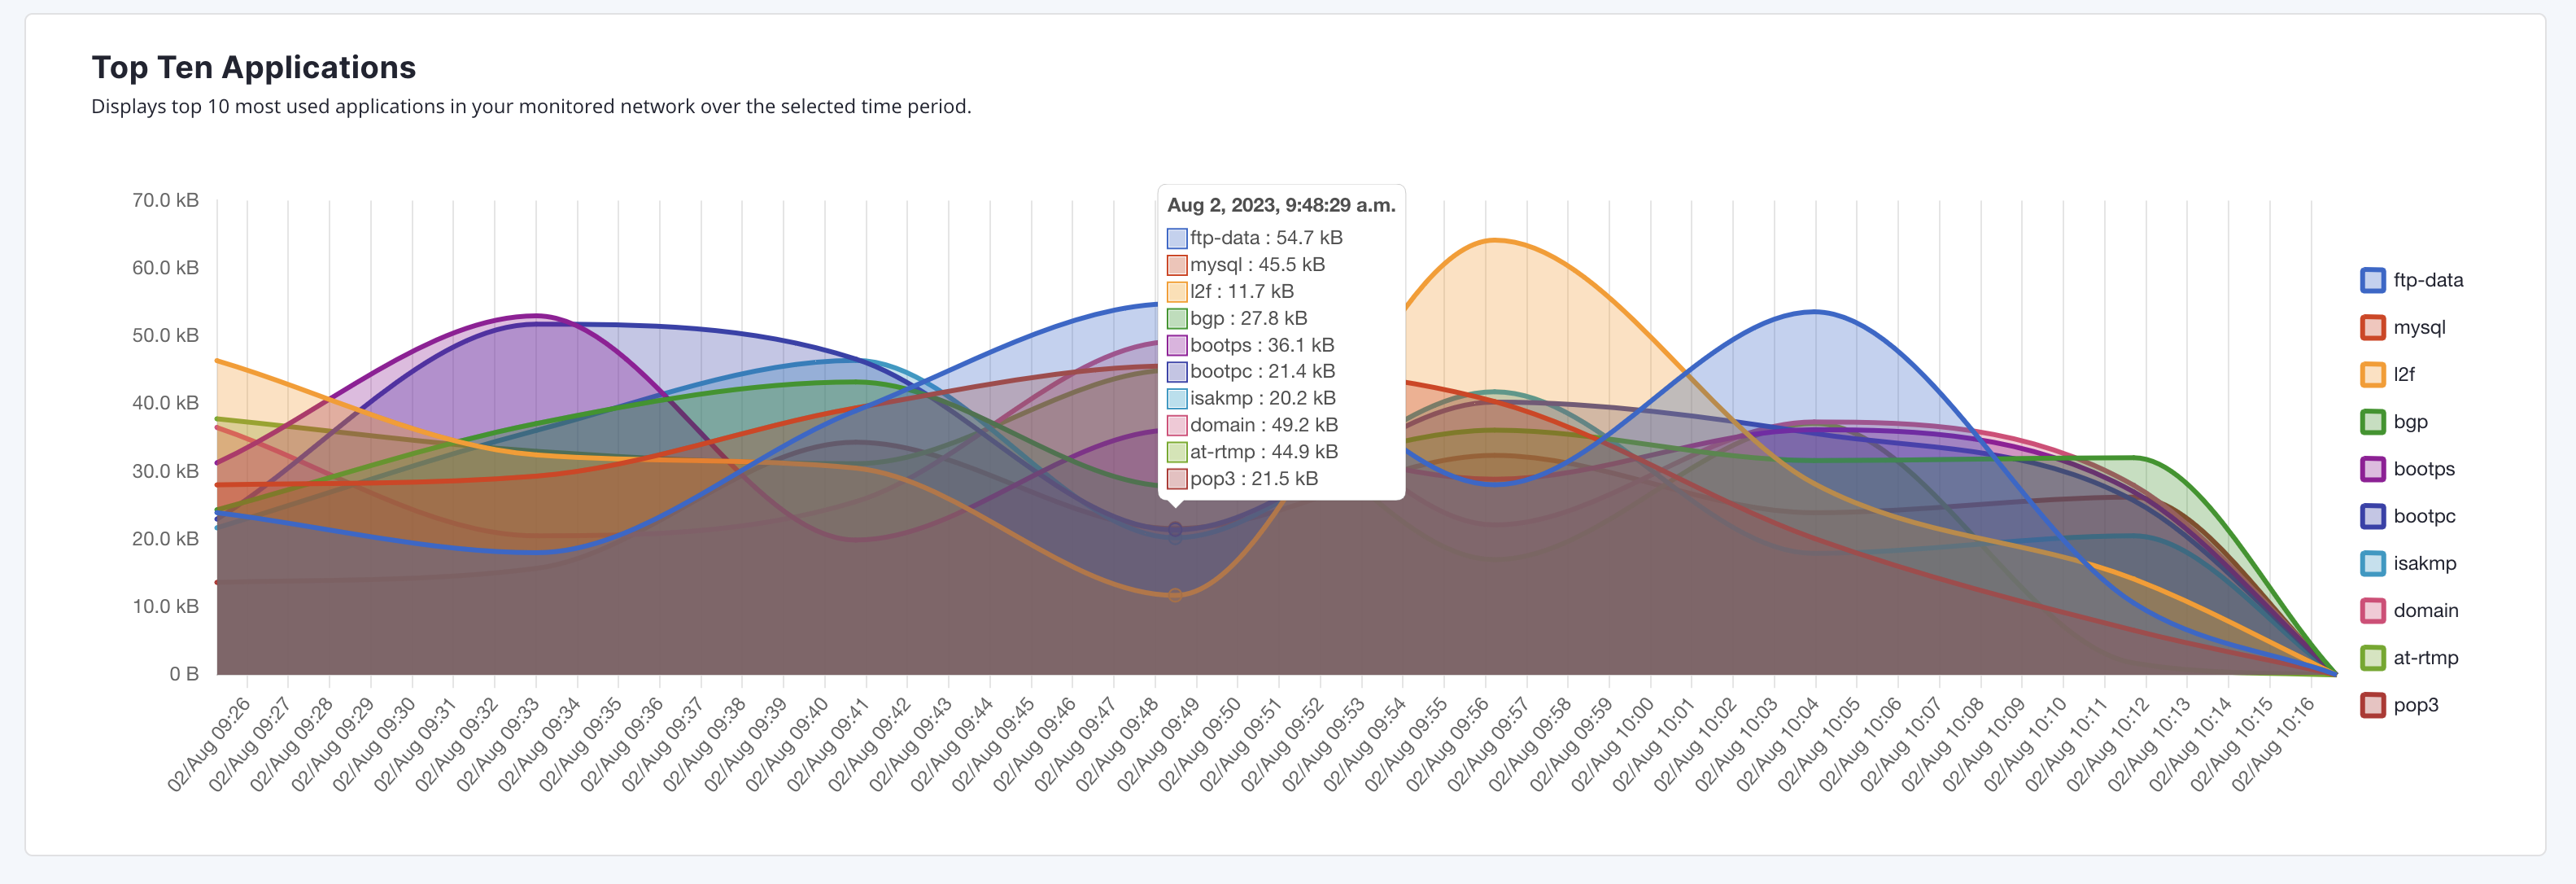
To filter by protocol on a line graph, click the protocols on the right side. They will appear crossed out, and data from the corresponding protocol will no longer appear in the graph. Click on the crossed-out protocol to make the data reappear.
Troubleshooting flows
By default, the OpenNMS secure collector (Minion) collects flows data from any device that sends flows and is monitored with SNMP. This includes support for NetFlow v5, NetFlow v9, and IPFIX.
If you do not see any flows data (for example on the insights dashboard or flows page), make sure you have the following:
-
OpenNMS collector installed and running (see Minion Management).
-
One or more network devices (router, firewall) that sends flows and is monitored with SNMP.
Refer to the device’s manufacturer documentation to learn more about configuring a device to send flows.
-
Although not required, you may want to check that the device from which you want to collect flows data exists in your OpenNMS network inventory (see Create an Active Discovery and Manage Nodes).
| You will need the IP address of your collector to enable flows on your network devices. To determine the IP address of your collector, go to the Inventory page and locate the host that is running Docker with your collector. |