Panel Configuration
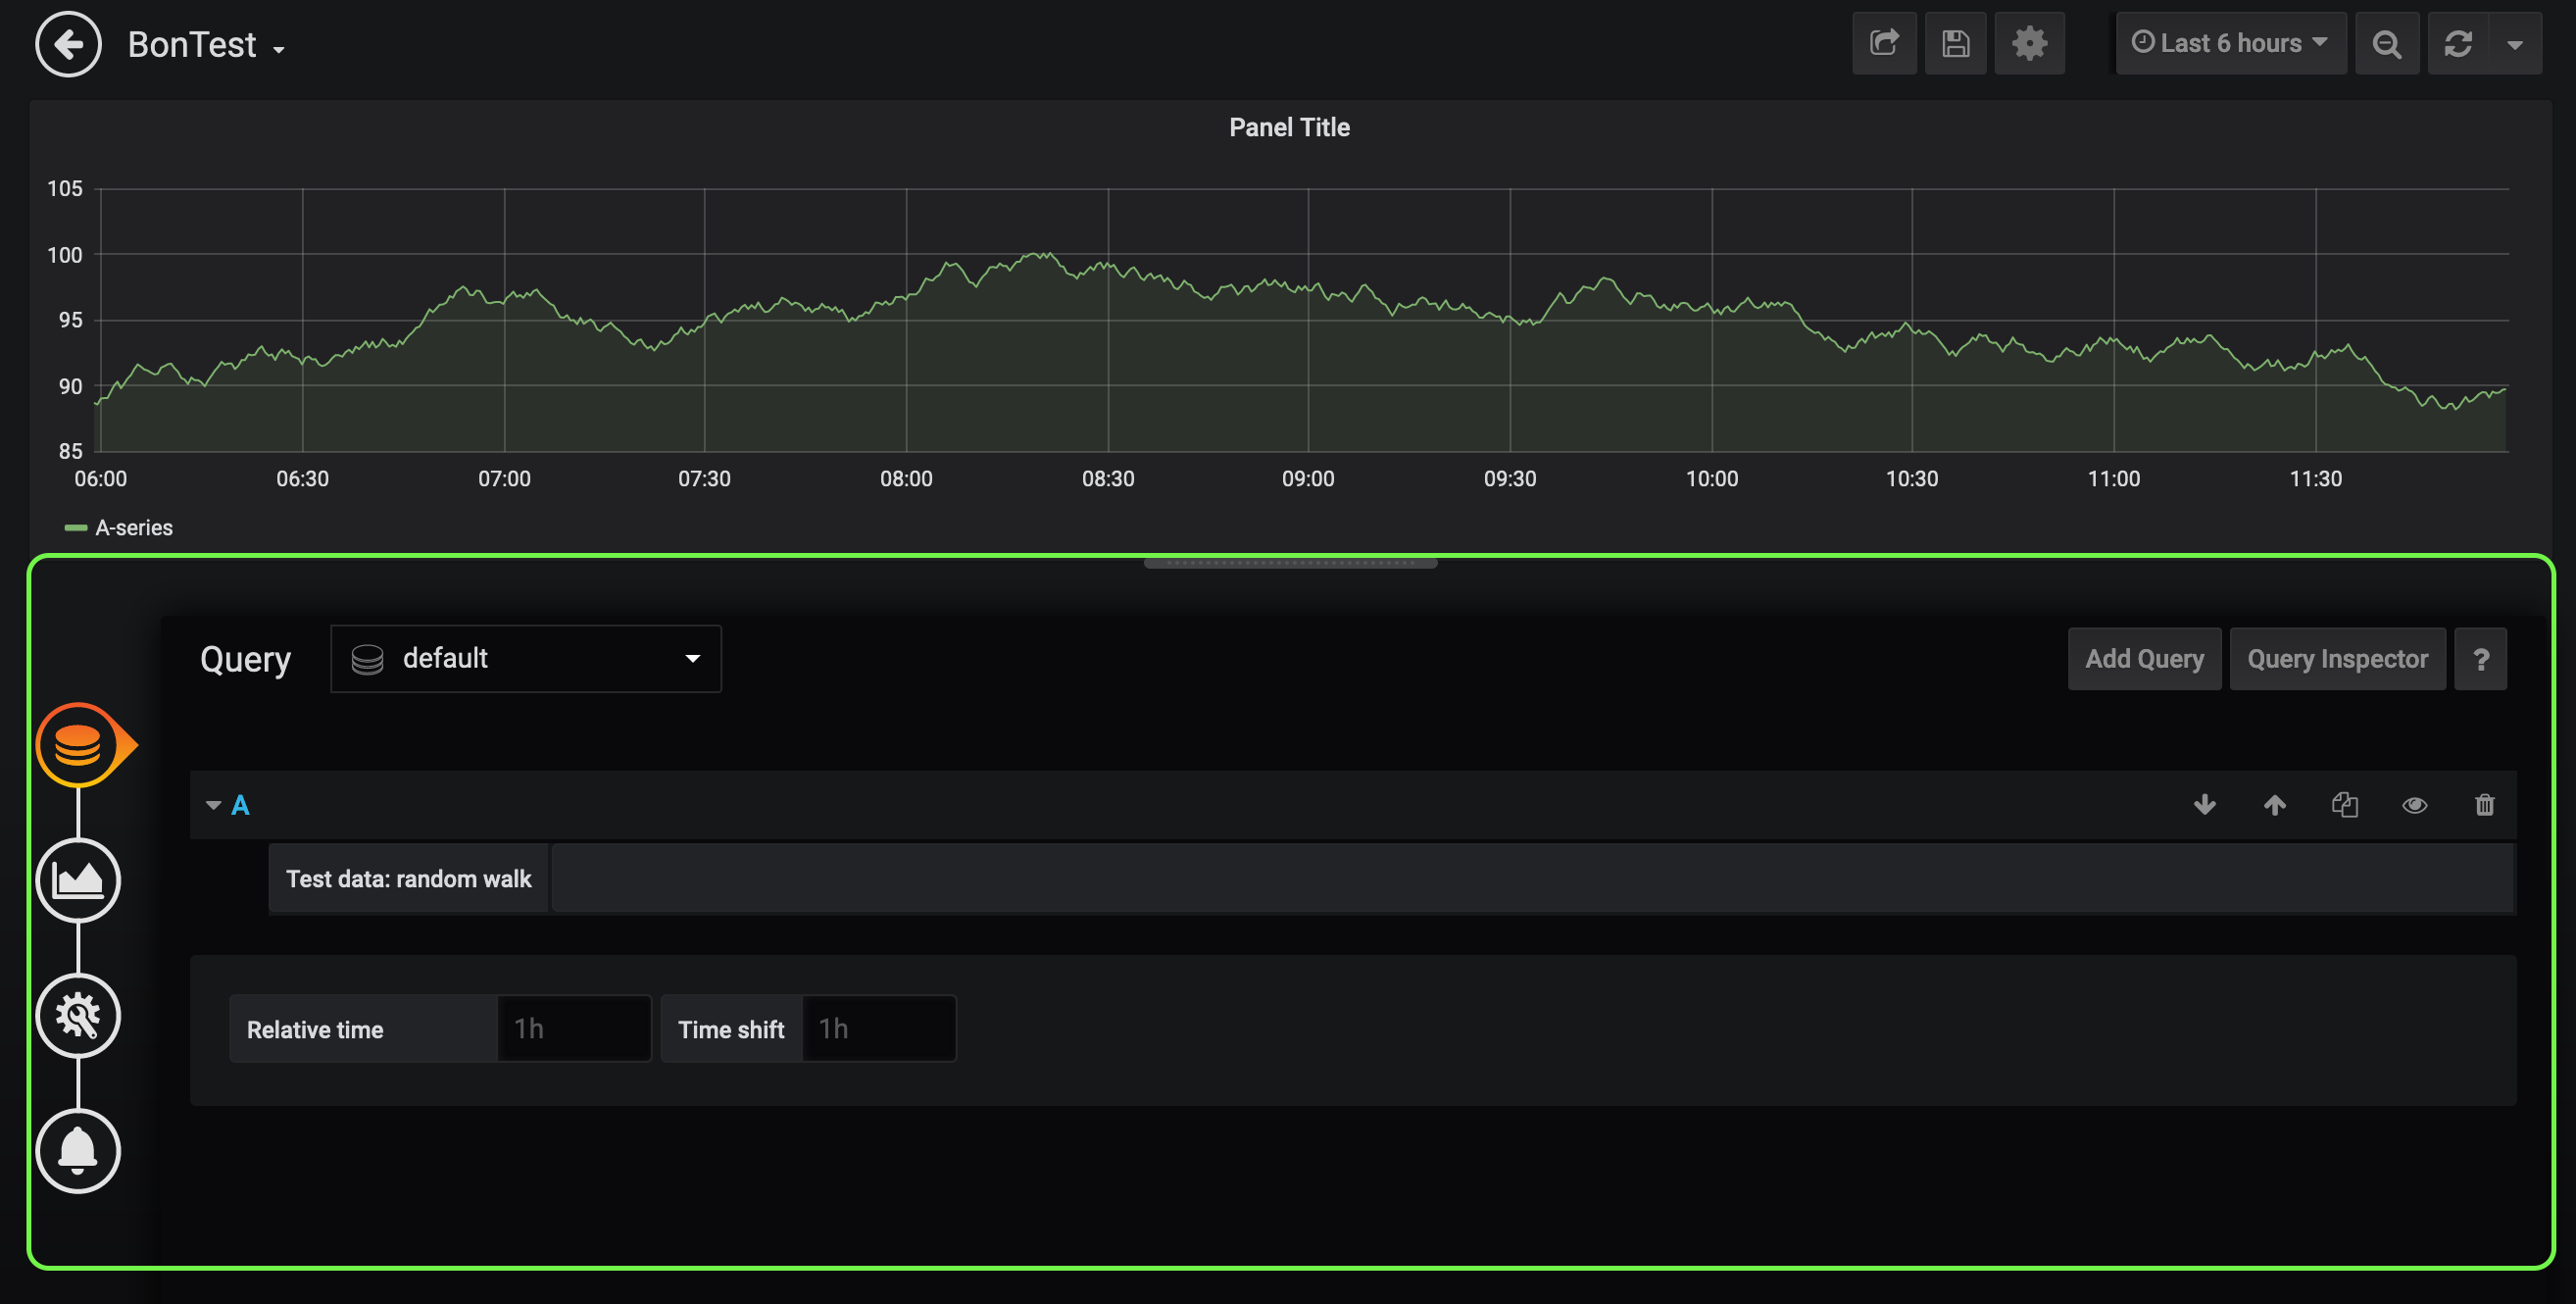
The grafana-plugin enables robust customization of dashboard panels, from updating their appearance and general information to configuring complex filters. You can configure a panel by interacting with its options in editing mode:
Configuration options depend on the type of datasource associated with a panel.
This section describes the following types of panel configuration:
Included custom panels
The plugin comes with several preconfigured custom panels:
-
Alarm histogram: A bar chart that shows the distribution of alarms by severity level.
-
Alarms table: A table that displays alarms.
-
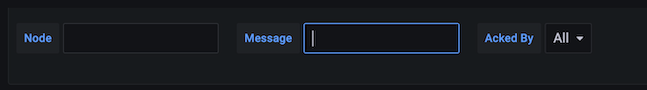
Filter panel: A panel that lets you filter entity data displayed in other panels. The filters created using this panel apply to all panels that use the same Entity datasource.
-
Flow histogram: A bar chart that shows the distribution of flows data. The query for this panel must include an
asTableSummary()transform, otherwise the panel will not display any data.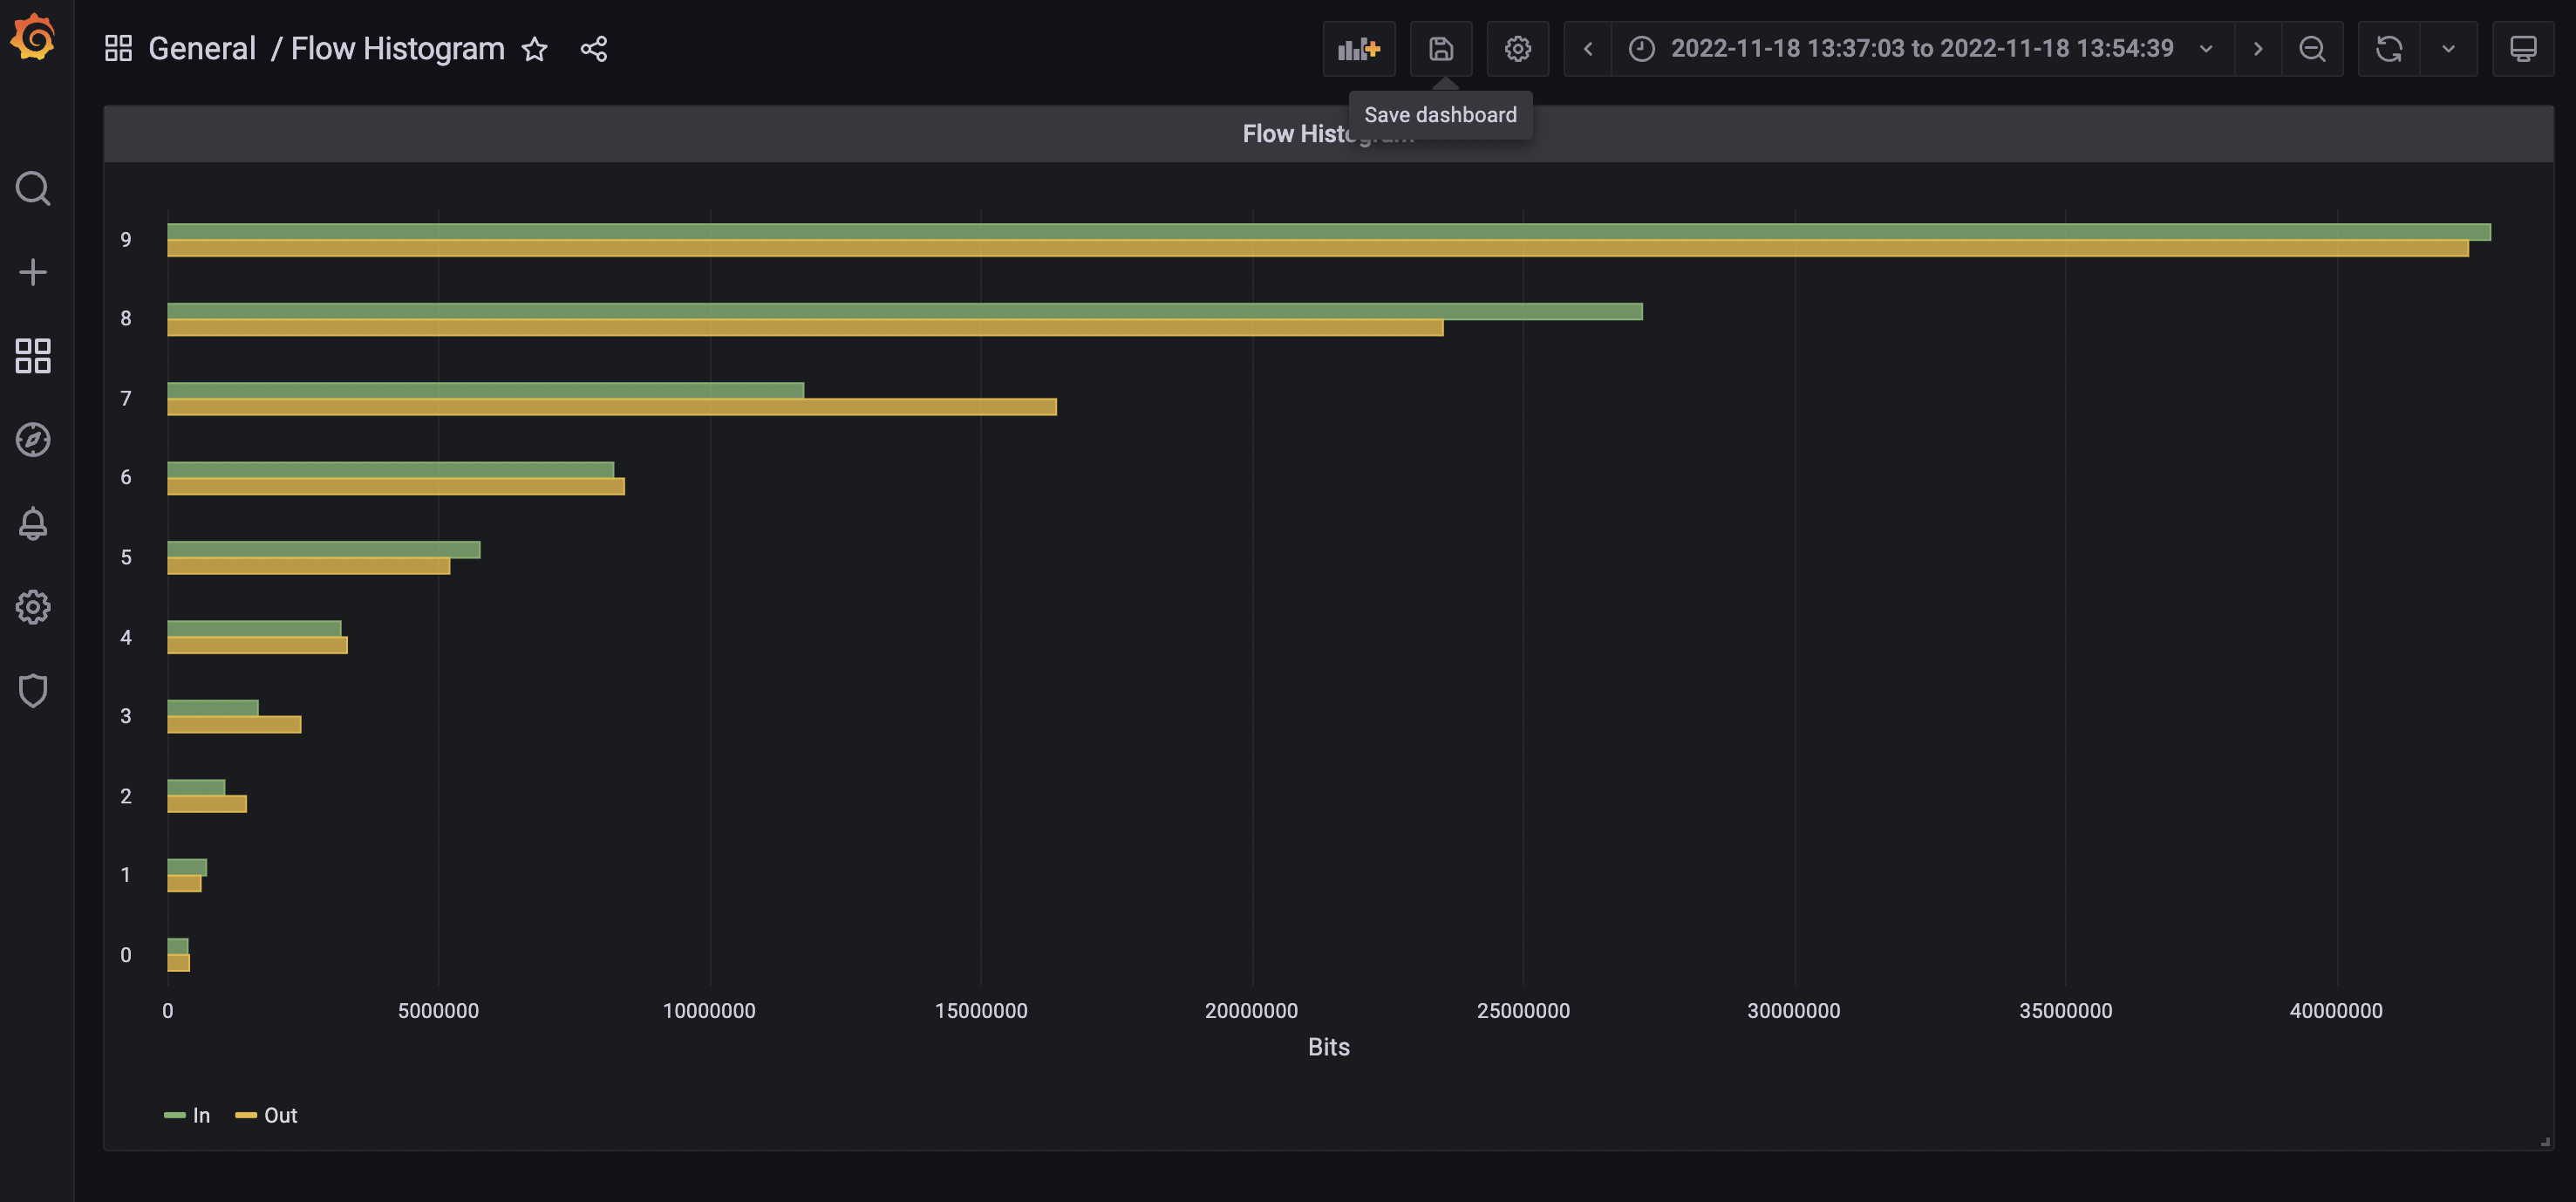
For a panel to display data visualizations, you must define the following settings:
-
Datasource
-
Flow Type
-
Time Interval
You can also add any other function or transformation to customize the visualized data.
Customize panels
You can customize the data visualized on the plugin panels by editing their settings and changing their datasources. The following procedures demonstrate how to set up each panel type to show data from the flows datasource.
Alarm histogram
Follow these steps to customize an alarm histogram panel:
-
Enter editing mode and select an alarm histogram panel on your dashboard.
-
Choose a datasource from the Data Source list (in this example, OpenNMS Entities).
-
Choose a display interval from the Time Interval list at the top of the panel.
-
Expand the Query Options section and update the settings as desired.
-
Edit the query using the fields at the bottom of the panel:
-
Choose a data type to display from the Select list (in this example, Alarms).
-
Set the visualization conditions using the Where options.
-
Choose the order in which the data is visualized from the Order By list.
-
(Optional) Set a limit on the amount of data displayed.
-
(Optional) Turn on the Featured Attributes option.
-
-
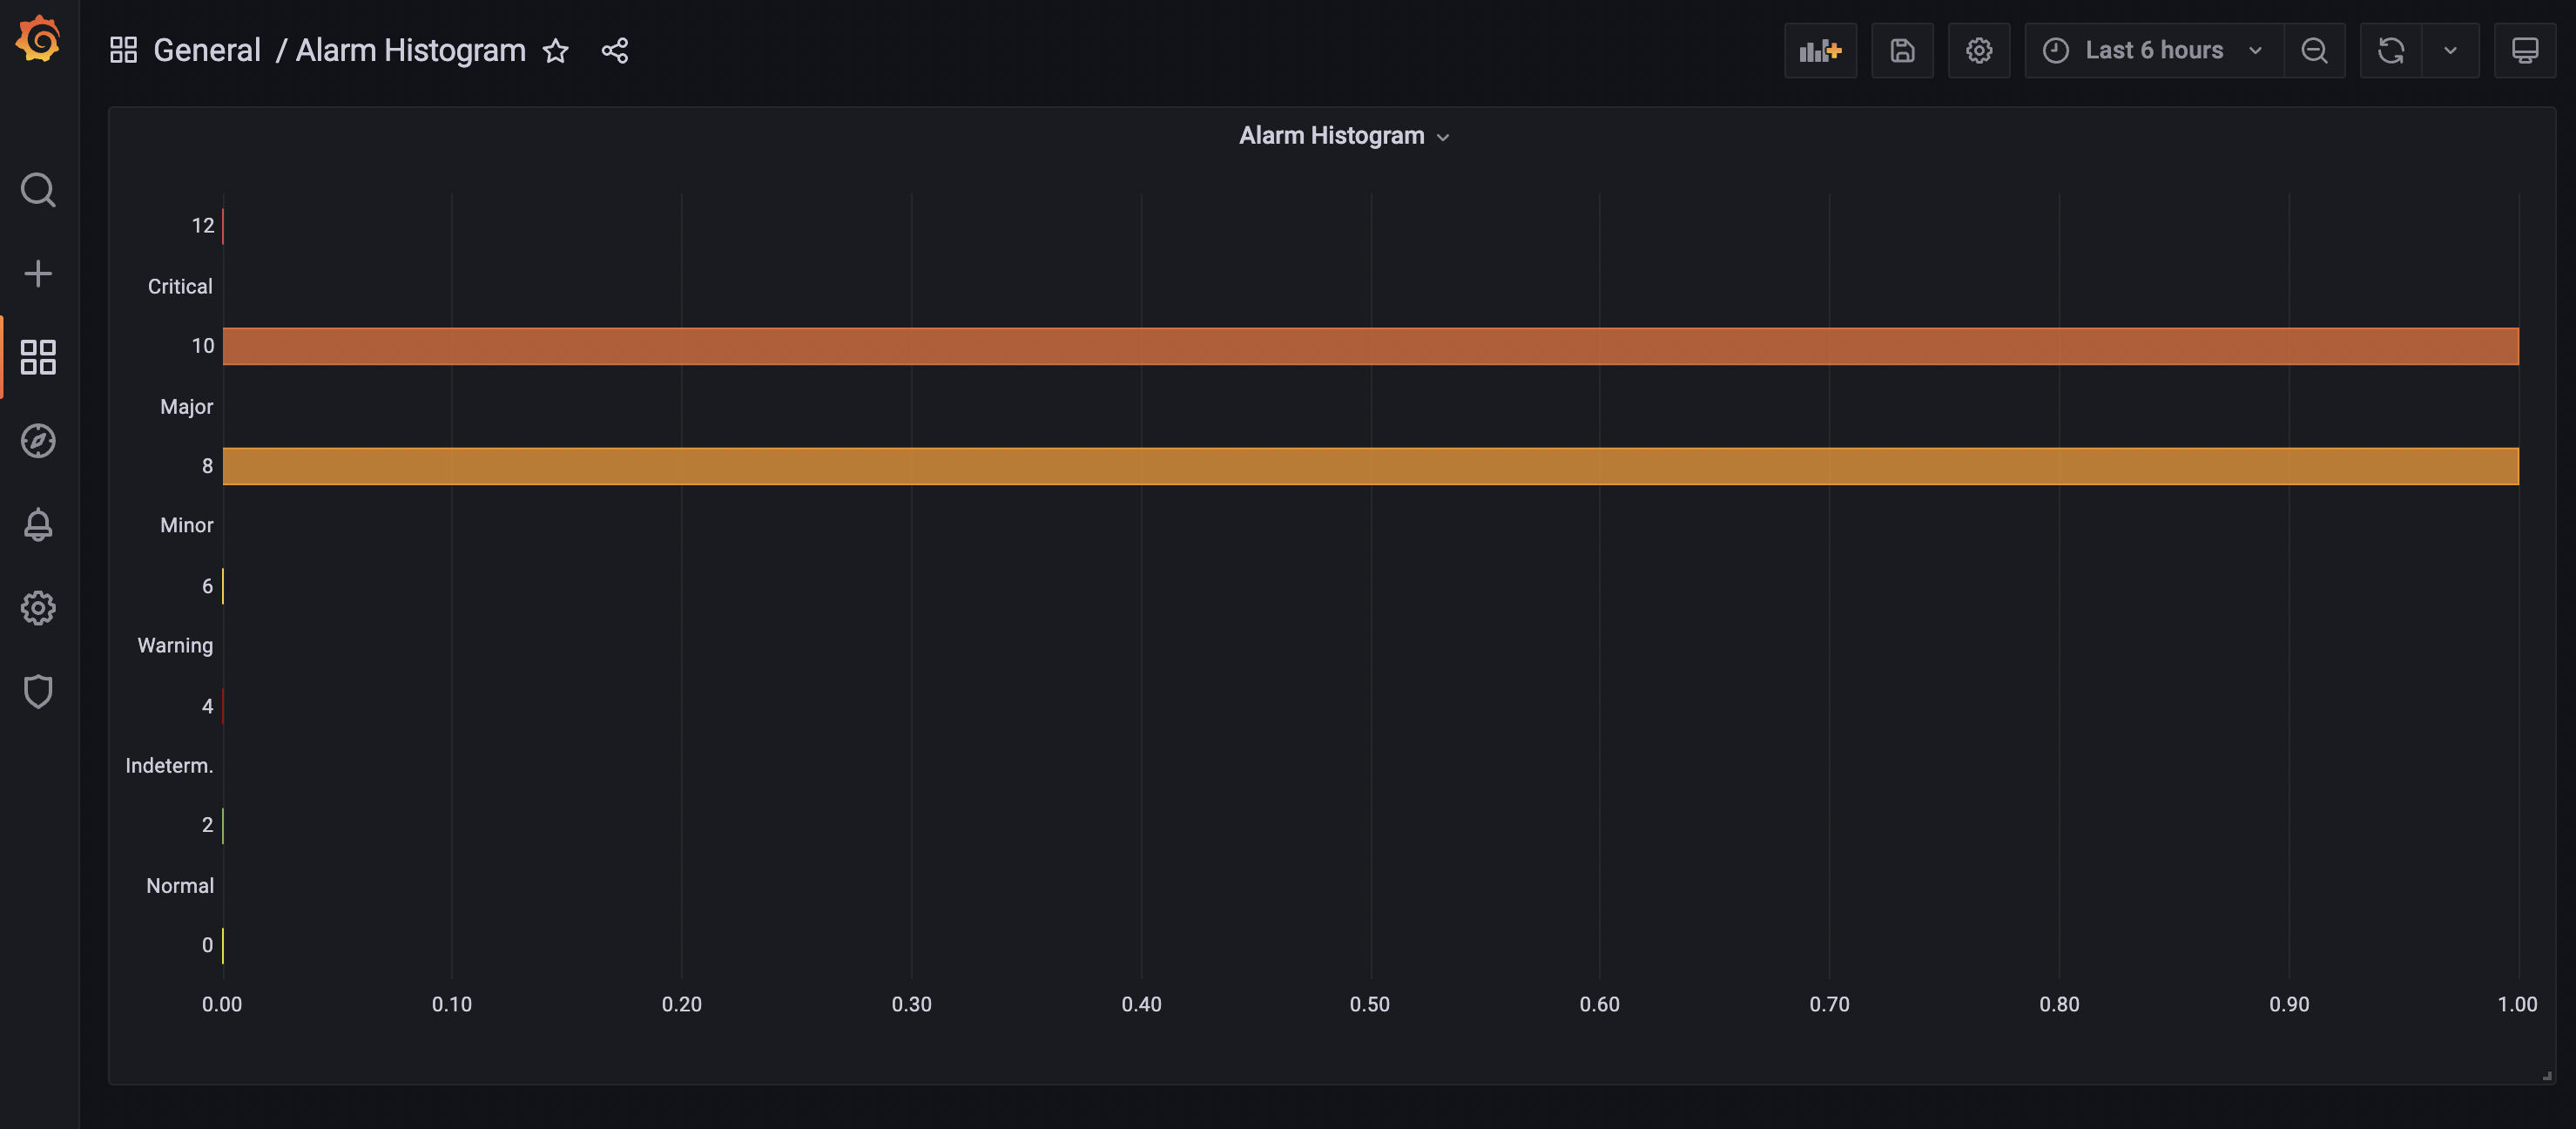
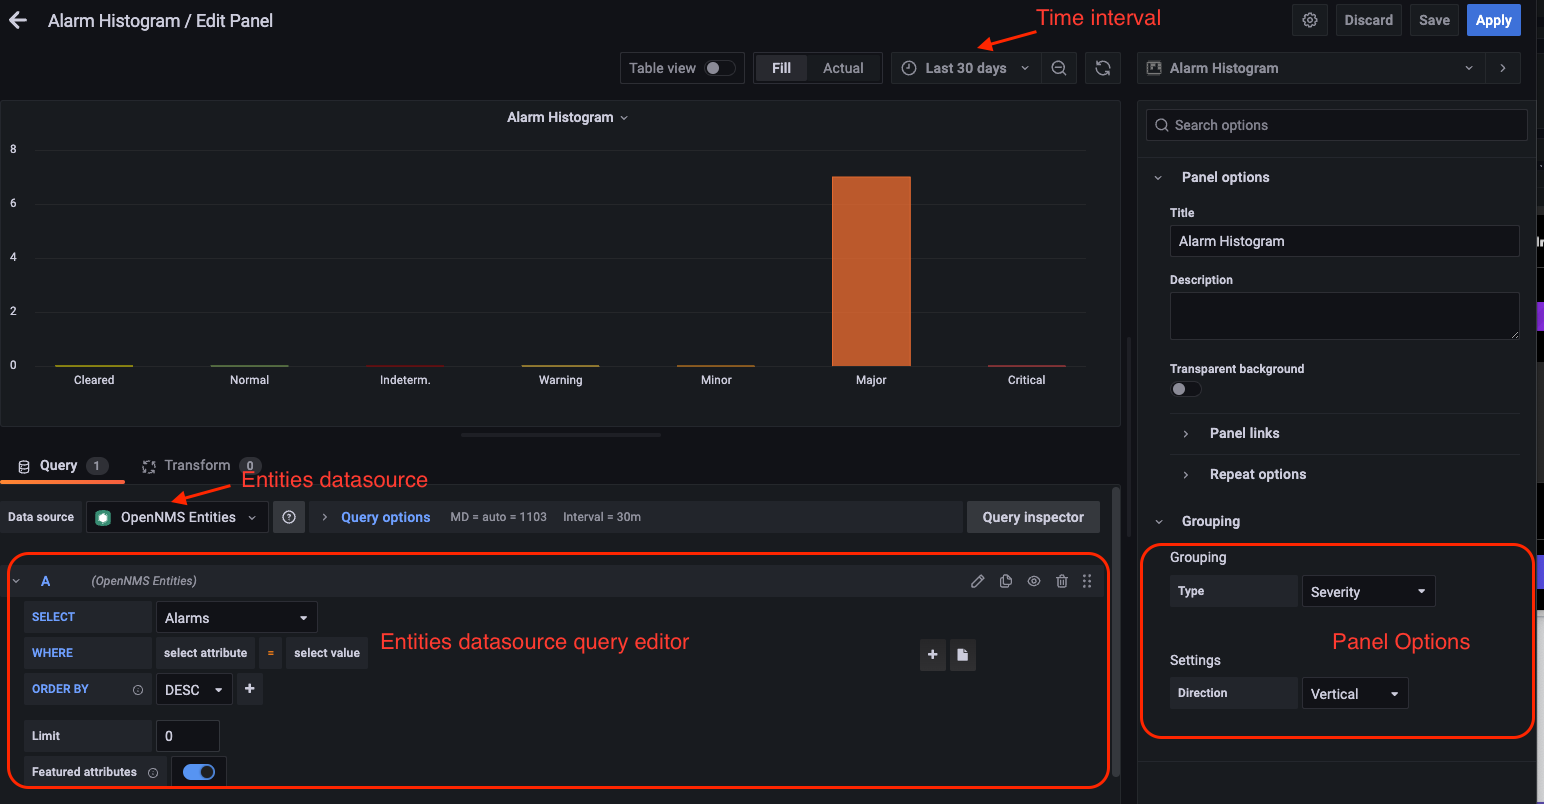
Update the panel options under the Grouping section:
-
Select the Grouping type (in this example, Severity). This sets the method by which data is grouped in the panel.
-
Select the display orientation using the Settings list (in this example, Vertical).
-
-
Set other display options as desired.
Using these settings, the alarm histogram panel displays the following visualization:
Alarms table
Follow these steps to customize an alarms table panel:
-
Enter editing mode and select an alarms table panel on your dashboard.
-
Choose a datasource from the Data Source list (in this example, OpenNMS Entities).
-
Choose a display interval from the Time Interval list at the top of the panel.
-
Expand the Query Options section and update the settings as desired.
-
Edit the query using the fields at the bottom of the panel:
-
Choose a data type to display from the Select list (in this case, Alarms).
-
Set the visualization conditions using the Where options.
-
Choose the order in which the data is visualized from the Order By list.
-
(Optional) Set a limit on the amount of data displayed.
-
(Optional) Turn on the Featured Attributes option.
-
-
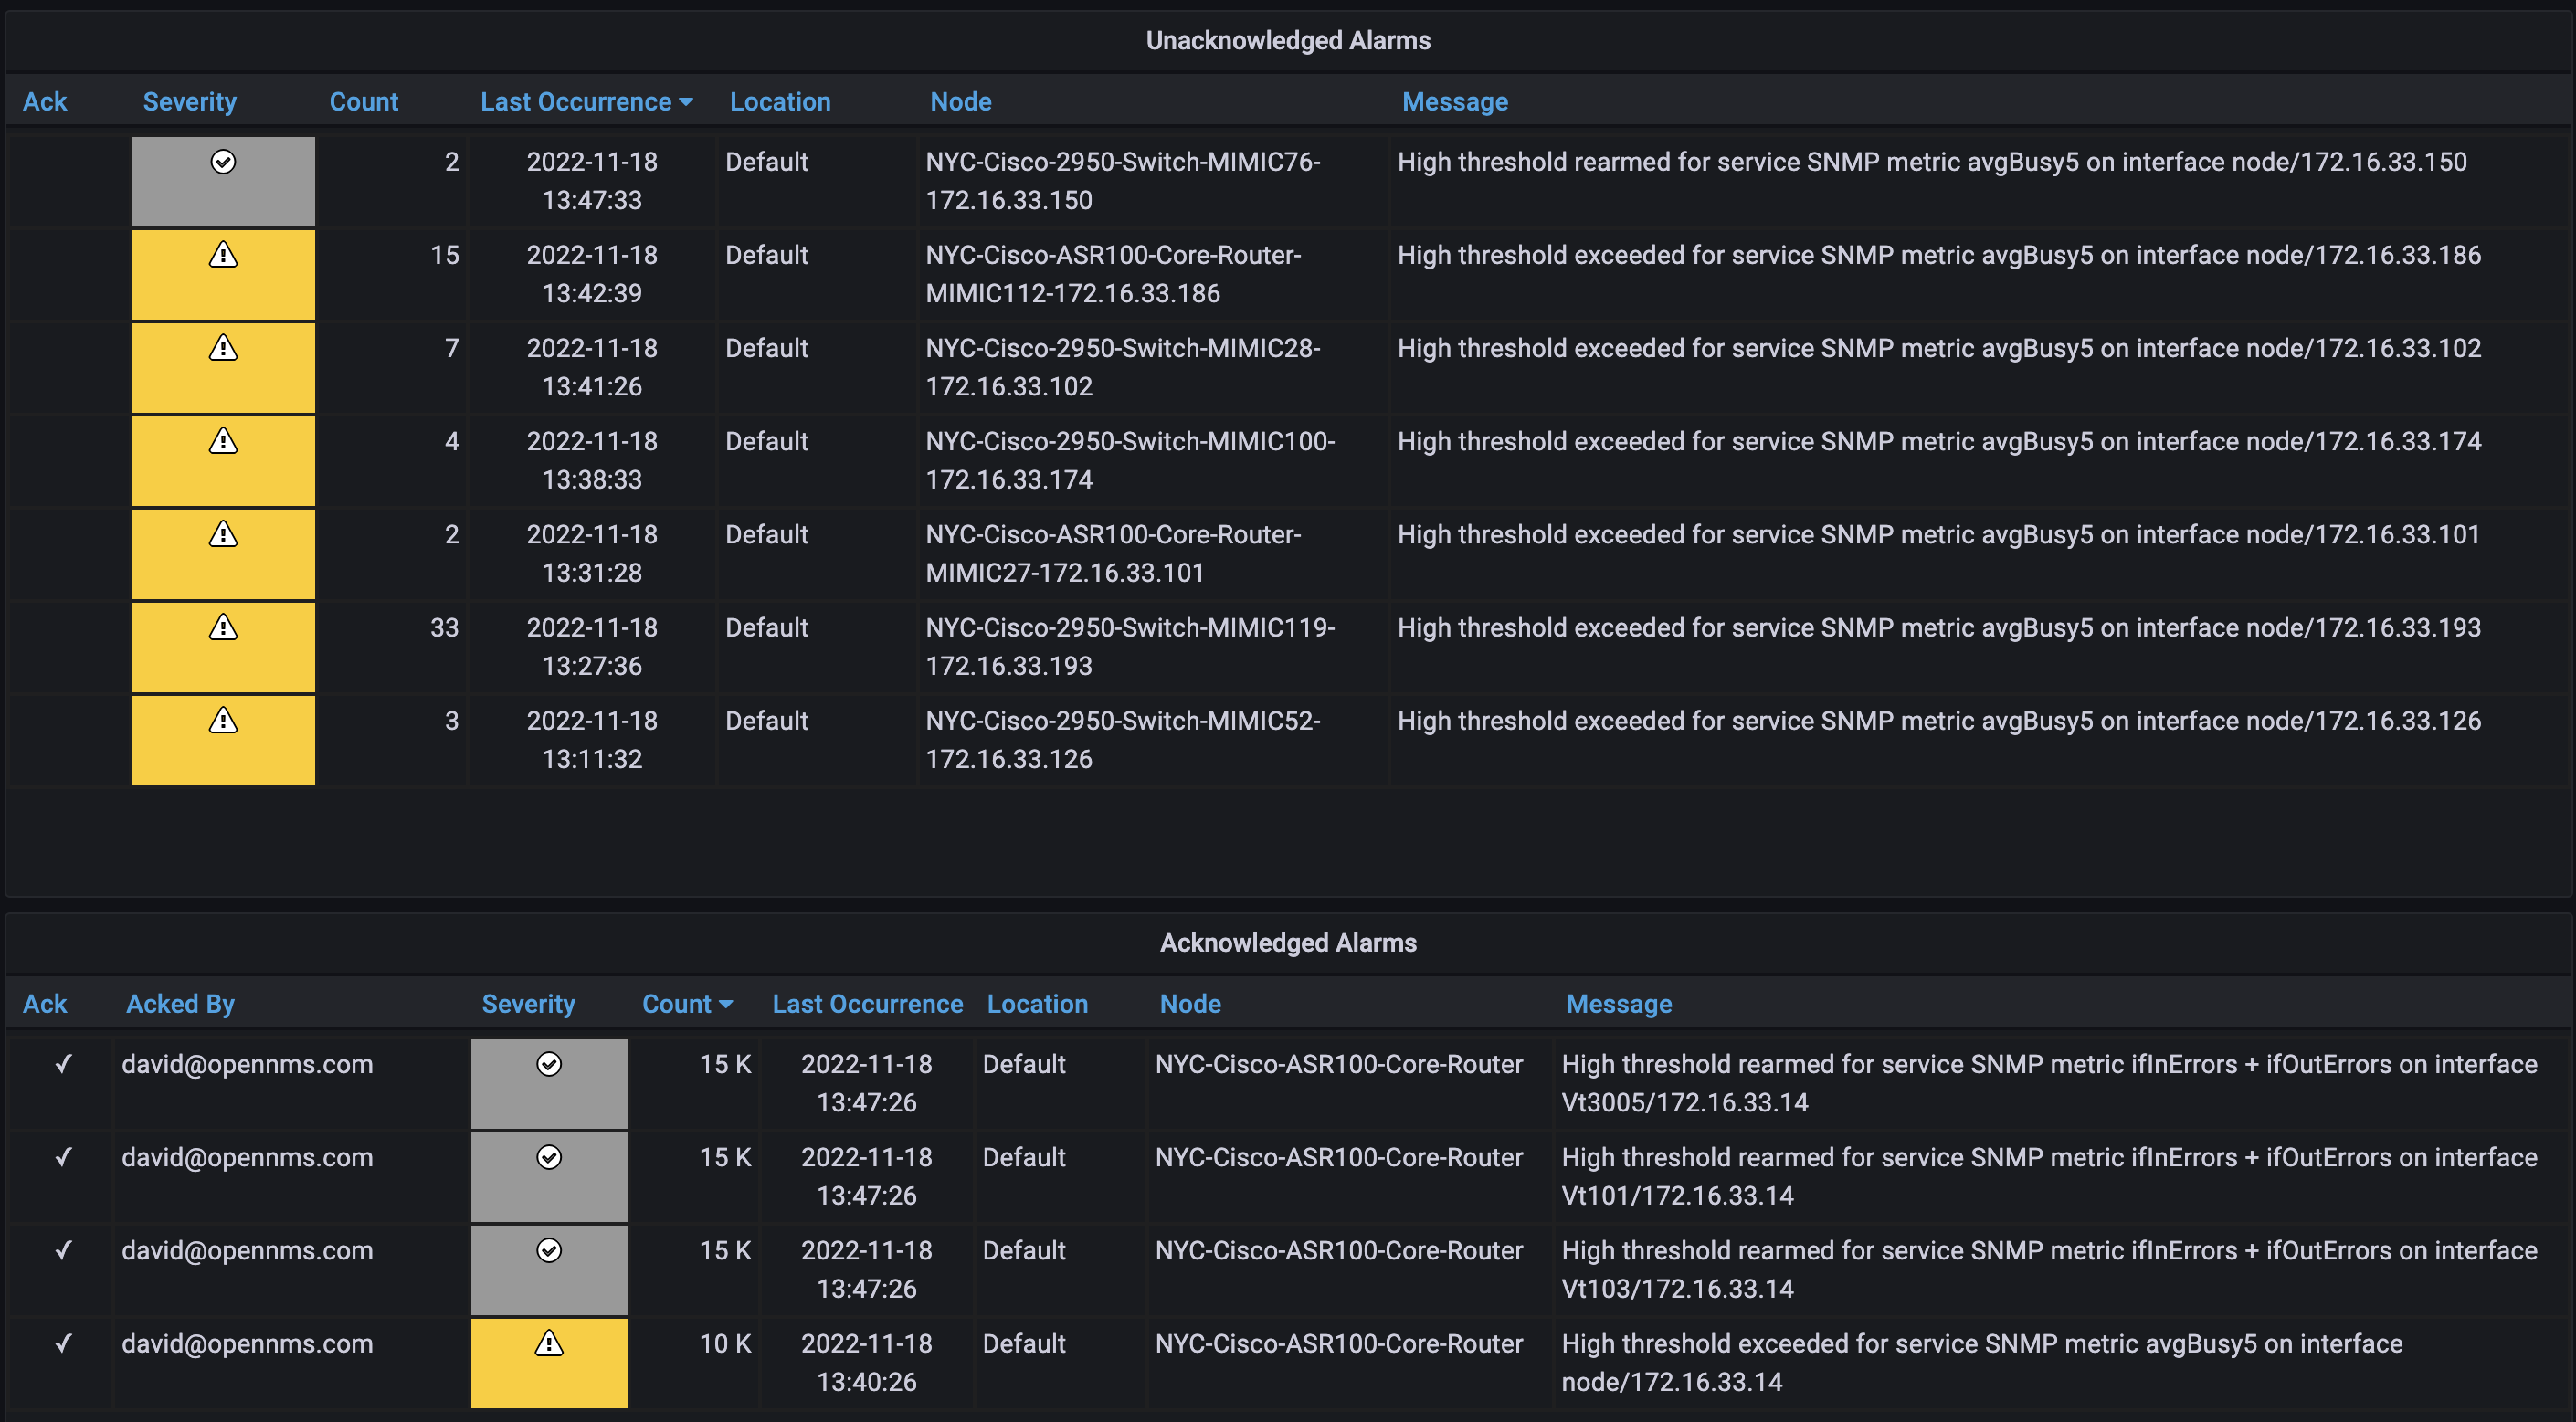
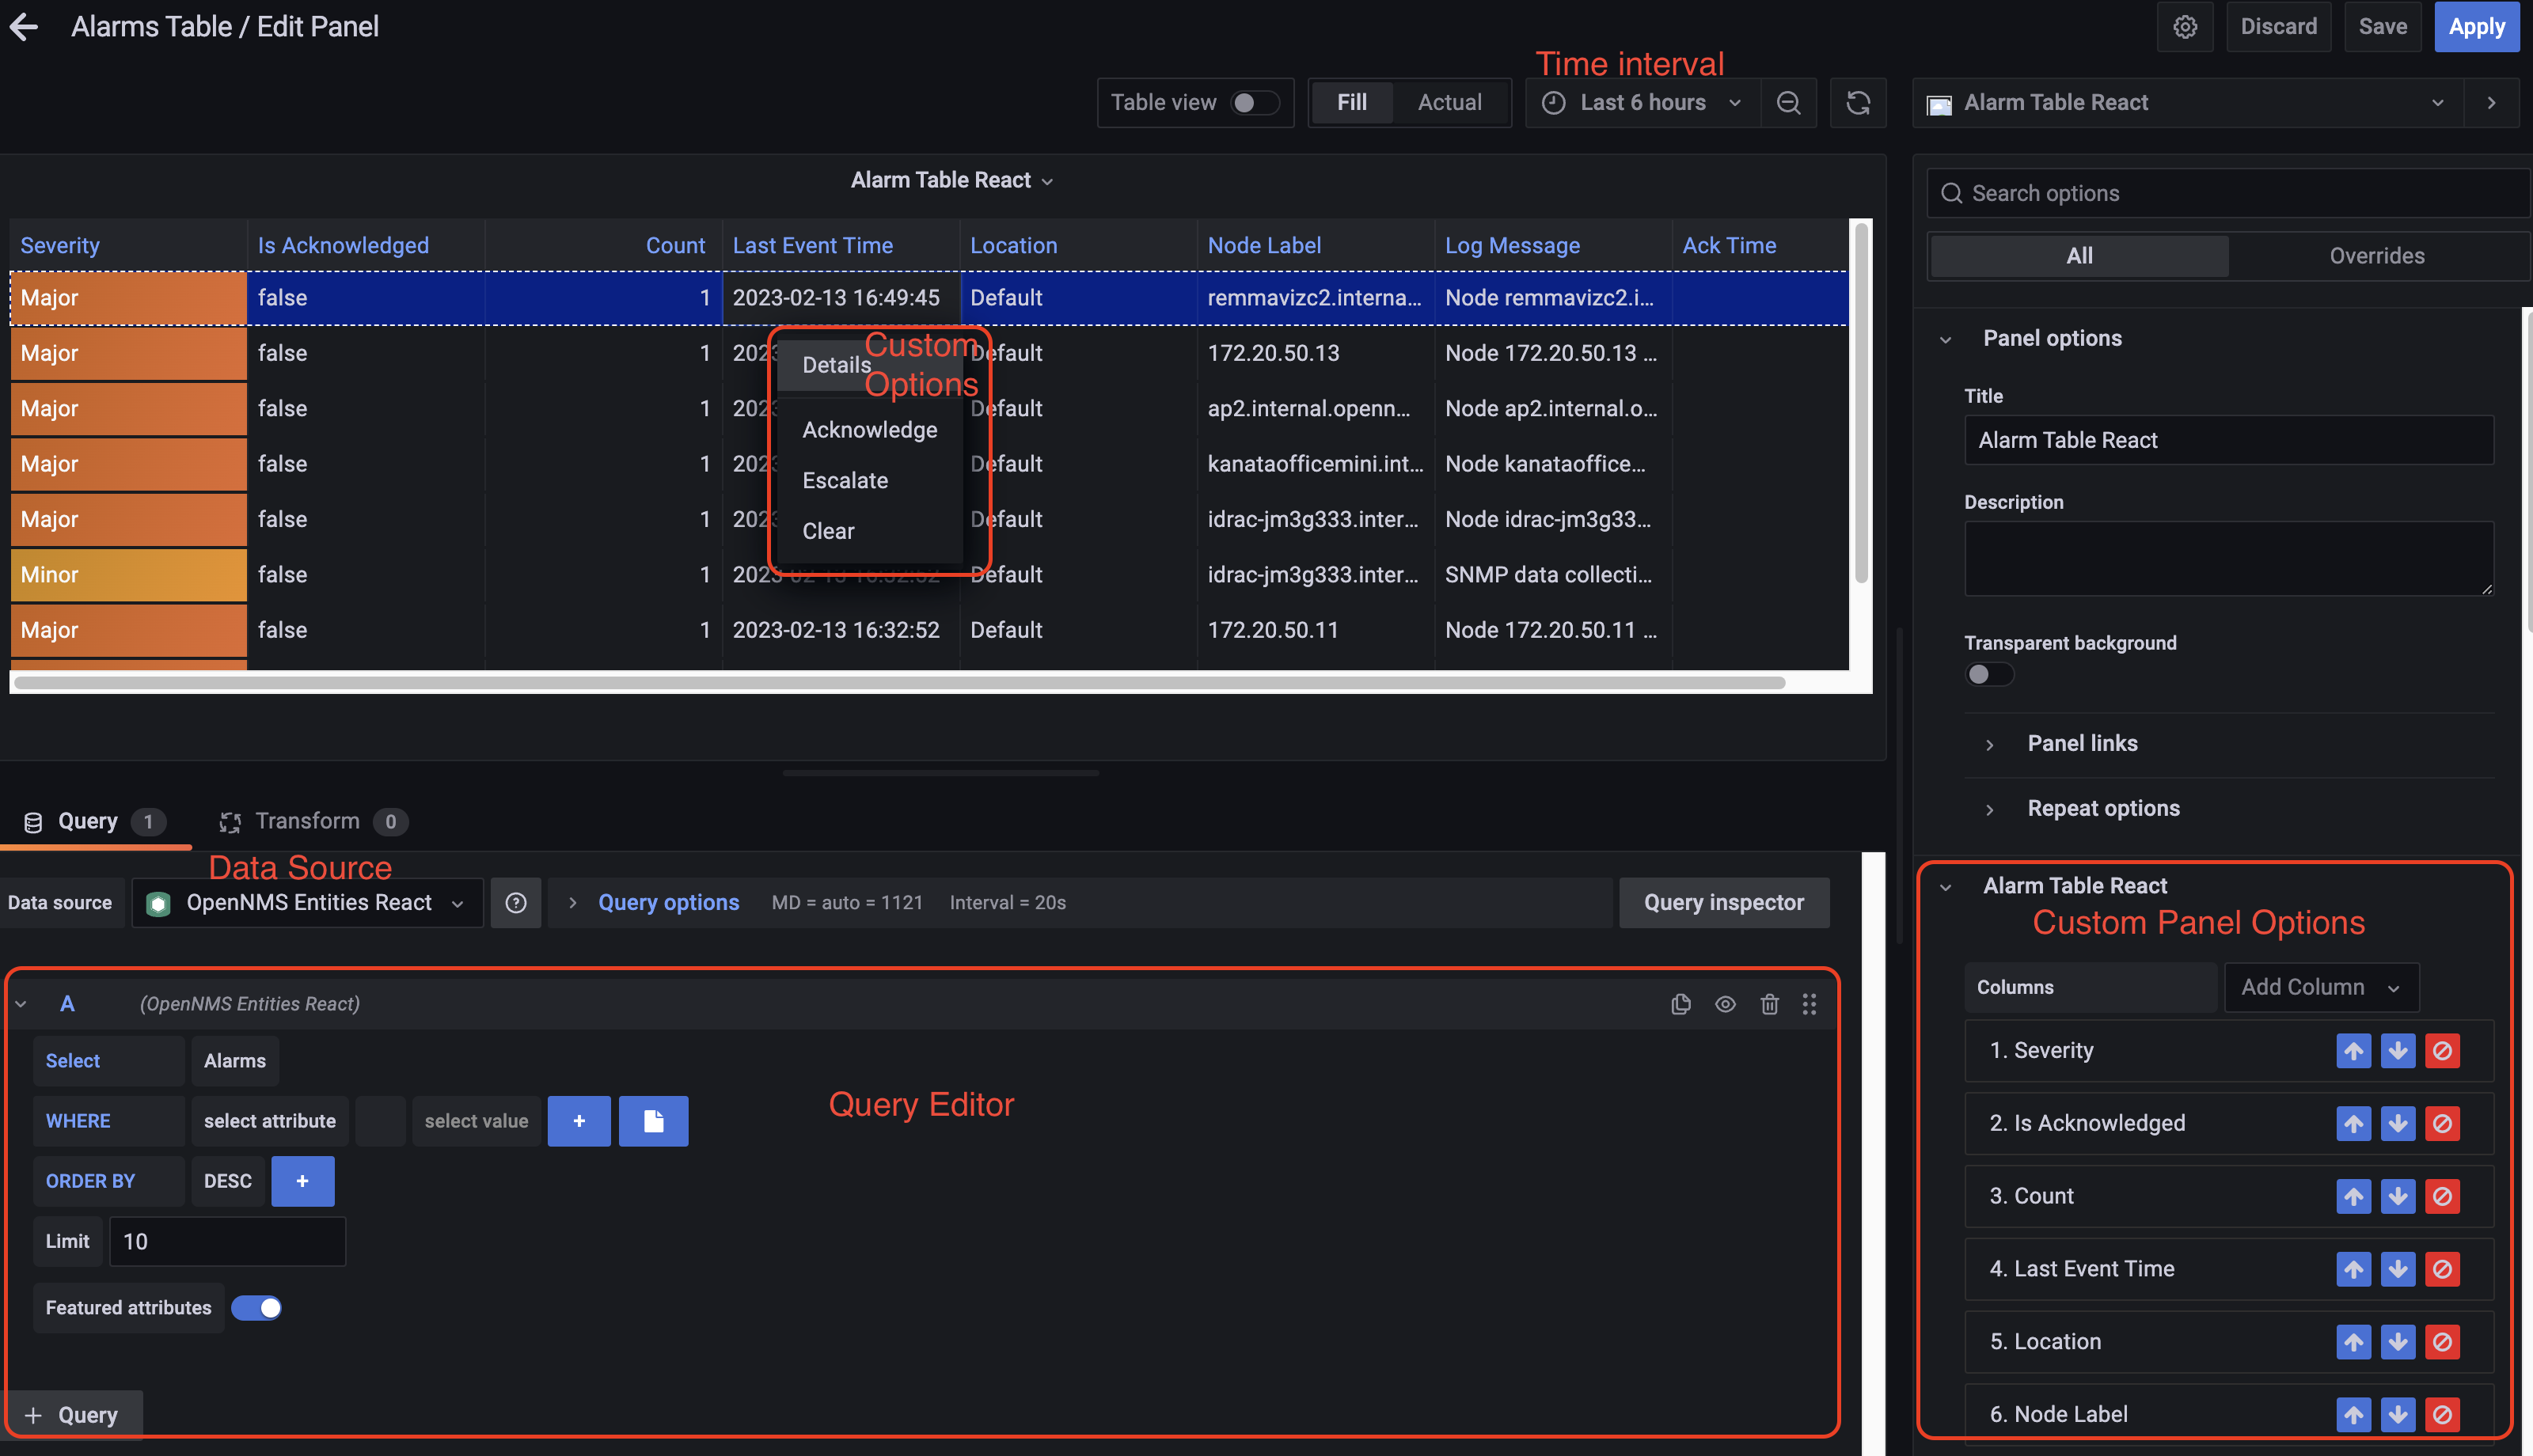
Add, remove, and reorder columns in the Alarm Table section.
-
Set other display options as desired.
After the panel is configured, you can right-click on an entry to access the context menu. From there, you can access an alarm’s Details and Acknowledge, Escalate, or Clear it:
Flow histogram
Follow these steps to customize a flow histogram panel:
-
Enter editing mode and select a flow histogram panel on your dashboard.
-
Choose a datasource from the Data Source list (in this example, OpenNMS Flow).
-
Choose a display interval from the Time Interval list at the top of the panel.
-
Expand the Query Options section and update the settings as desired.
The query must include an asTableSummary()transform, otherwise the panel will not display any data. -
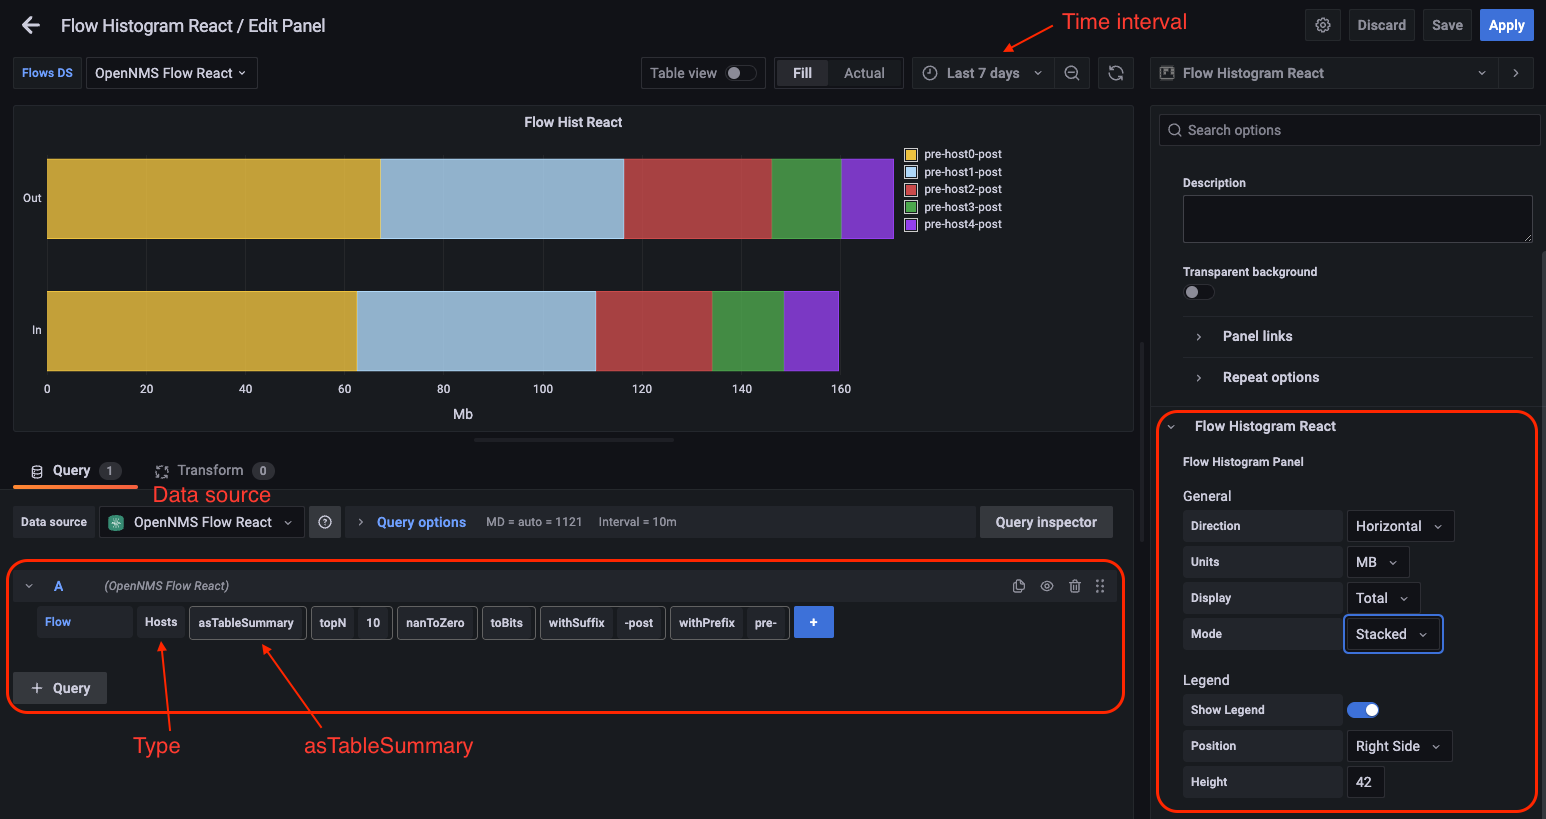
Edit the query using the Flow options at the bottom of the panel.
-
Update the panel options under the Flow Histogram section:
-
Select the display orientation using the Direction list (in this example, Horizontal).
-
Select the measurement units using the Units list (in this example, MB).
-
Choose the visualization method using the Display list (in this example, Total).
-
Select the grouping type using the Mode list (in this example, Stacked). This sets the method by which data is grouped in the panel. Stacked displays cumulative data from all sources, grouped by incoming and outgoing data.
-
(Optional) Update the legend settings as desired.
-
-
Set other display options as desired.
Using these settings, the flow histogram panel displays the following visualization:
Functions and transformations
Each OpenNMS Plugin for Grafana datasource has functions and transformations associated with it. Functions let you perform actions based on the data transmitted by the datasource. Transformations are functions that let you convert data or choose to display only certain types of information (for example, only ingress or egress traffic).
For more information and lists of specific functions, see the Datasources section.