Upgrade the Plugin for Grafana
This section describes how to upgrade your Plugin for Grafana installation. Usually, upgrading simply involves installing the new package. Major version releases, however, can sometimes introduce breaking changes; in this case, upgrading may be more complex.
| If you are upgrading your plugin to version 9.x, you must export and upgrade your dashboards. If you have only one Grafana instance running one Plugin for Grafana installation, your dashboards must be exported before you upgrade the plugin. |
Before proceeding, make sure that you have installed the latest version of the plugin. You should also have Node.js installed.
Upgrade datasources
Follow these steps to upgrade your datasources:
-
Install Wizzy and create a directory for your datasources:
npm i -g wizzy mkdir /tmp/wizzy cd /tmp/wizzy -
Configure Wizzy to communicate with your Grafana instance:
# create a local wizzy project directory wizzy init # configure Grafana login information wizzy set grafana url http://localhost:3000 wizzy set grafana username admin wizzy set grafana password admin -
Export your datasources to the Wizzy project directory:
wizzy import datasources -
Convert any
faultdatasources toentity:perl -pi -e 's/opennms-grafana-plugin-fault-datasource/opennms-grafana-plugin-entity-datasource/g' datasources/*.json -
Publish your changes to your Grafana instance:
wizzy export datasources
Upgrade dashboards for version 9.x
When you upgrade your Plugin for Grafana installation to version 9.x, you must upgrade any previously existing dashboards. If they are not upgraded, they will not be displayed.
The OpenNMS Plugin for Grafana version 9.x includes a dashboard conversion tool to upgrade dashboards created using previous versions.
| You must export your dashboards from a previous version of the plugin. You can export them before you upgrade your Plugin for Grafana installation, or from a separate Grafana instance that is running the previous version. |
When you export a dashboard, a JSON file is produced containing its settings and associated data.
After you export your old dashboards, upgrade your plugin to version 9.x. Next, use the conversion tool to update your dashboards:
-
Click the Add Panel symbol.
-
Click Add New Panel.
-
Select the Dashboard Convert panel.
-
On the Dashboard Convert panel, select the version of the plugin from which you exported the dashboard using the Source Plugin Version list.
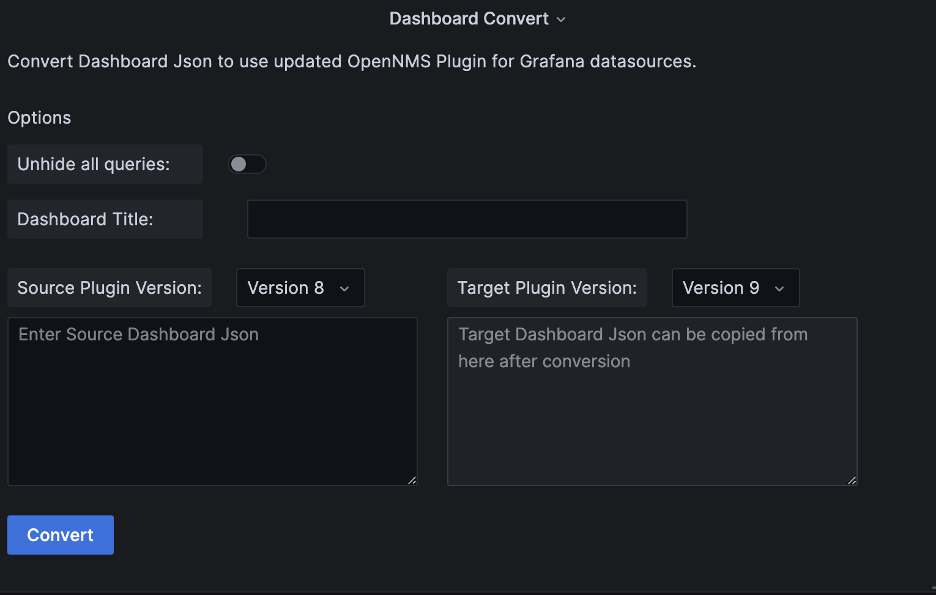 Figure 1. Dashboard Convert panel
 -
Paste the contents of a dashboard JSON file in the Enter Source Dashboard JSON box. The dashboard’s name should appear in the Dashboard Title box.
-
(Optional) Edit the Dashboard Title.
-
(Optional) Toggle Unhide All Queries on or off, as desired. Toggling this on marks all OpenNMS datasource queries as visible, which may be useful for troubleshooting.
-
-
Click Convert. The converted JSON is displayed in the Target Dashboard JSON box.
-
Copy the converted JSON and use it to import a dashboard.
| The conversion tool may not handle all patterns in variables and resource names. After you convert your dashboards, test them to ensure that all of the associated data is correct. Note as well that you must define variables before using them in an expression. The conversion tool does not reorder items for you, so make sure to check that you have done so. |