Dynamic Dashboards
Rather than hard-coding specific information (such as node names or resource IDs) in a panel, the OpenNMS Plugin for Grafana offers several ways to create more dynamic and interactive dashboards.
Template variables
Template variables can be used in metric queries and panel titles. They are also displayed as a drop-down list at the top of each dashboard. You can select variables from the list to filter the data that your dashboard displays:
Each datasource can accept different template variable queries. For example, the Performance datasource has two available template queries:
-
Specific nodes:
nodeFilter(NODEFILTERSTRING) -
Specific resources on a node:
nodeResources(NODEID[, id|label|name[, resource-type-name|*]])
For more information on template queries, see the Entities and Flow datasource pages.
Use template variables in a query
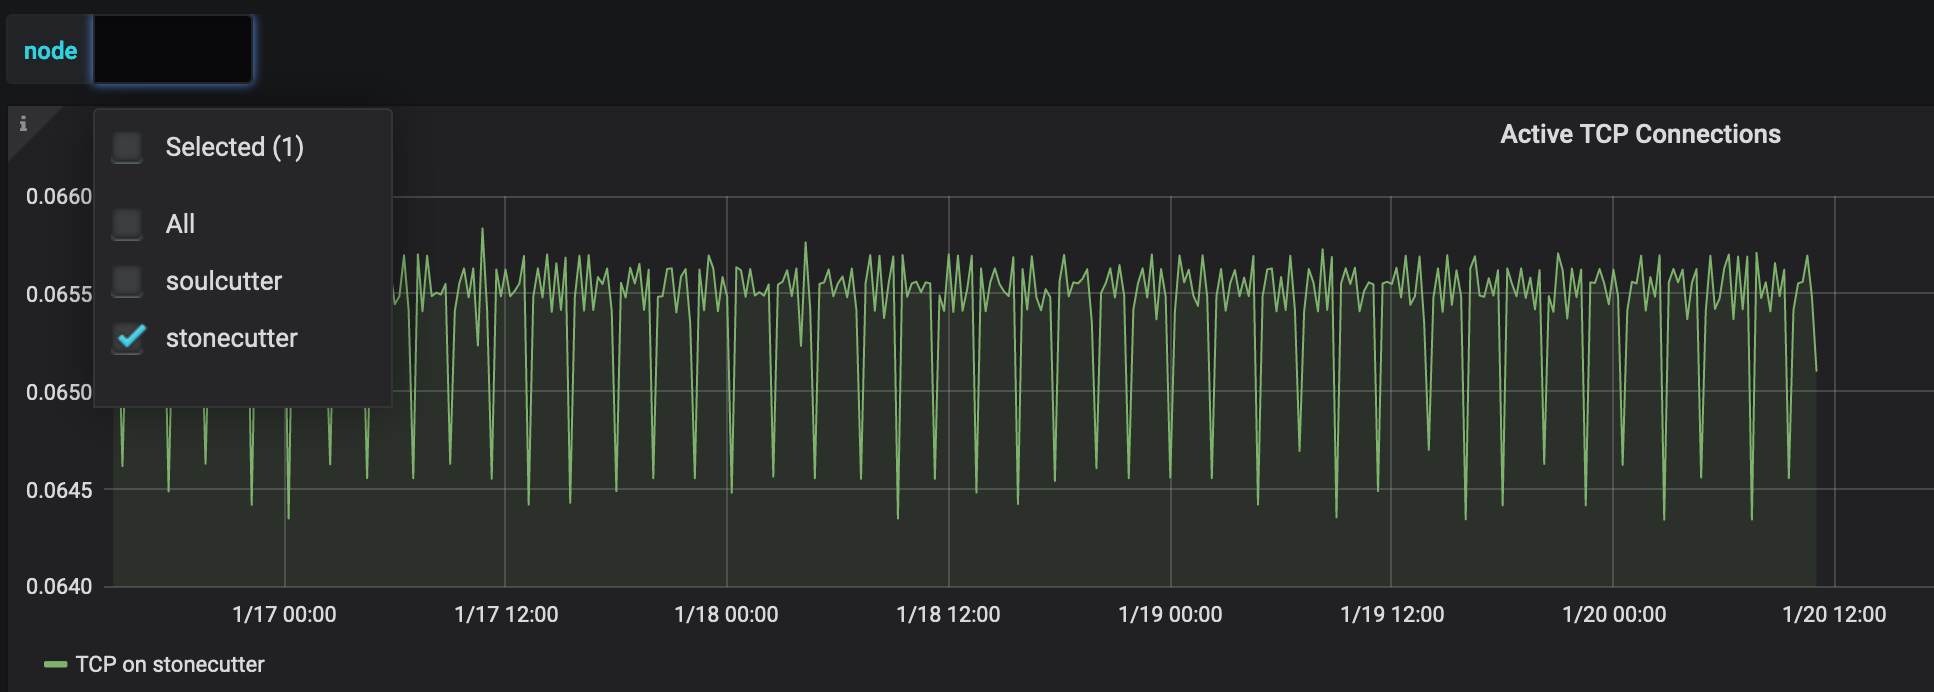
Follow these steps to use template variables in a query for a category of nodes (switches):
-
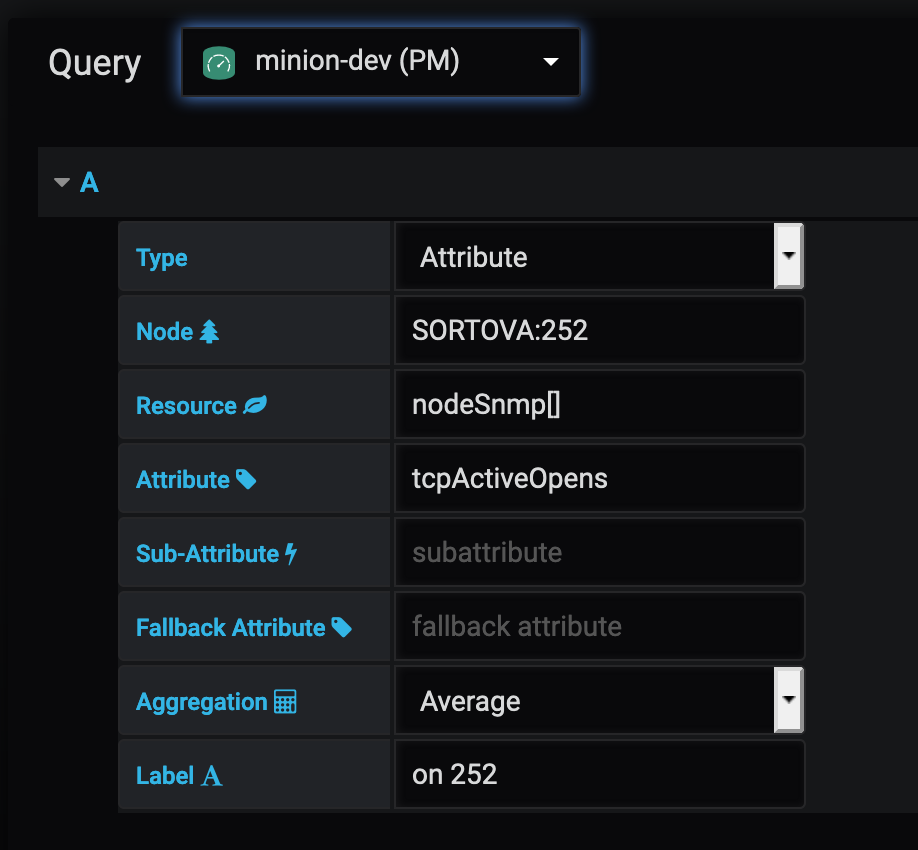
Select or create a panel. For this example, we created a panel that displays active TCP connections:
-
Click the Dashboard Settings symbol at the top-right of the panel.
-
Select .
-
Configure your desired settings. A preview of the returned values is displayed at the bottom of the page:
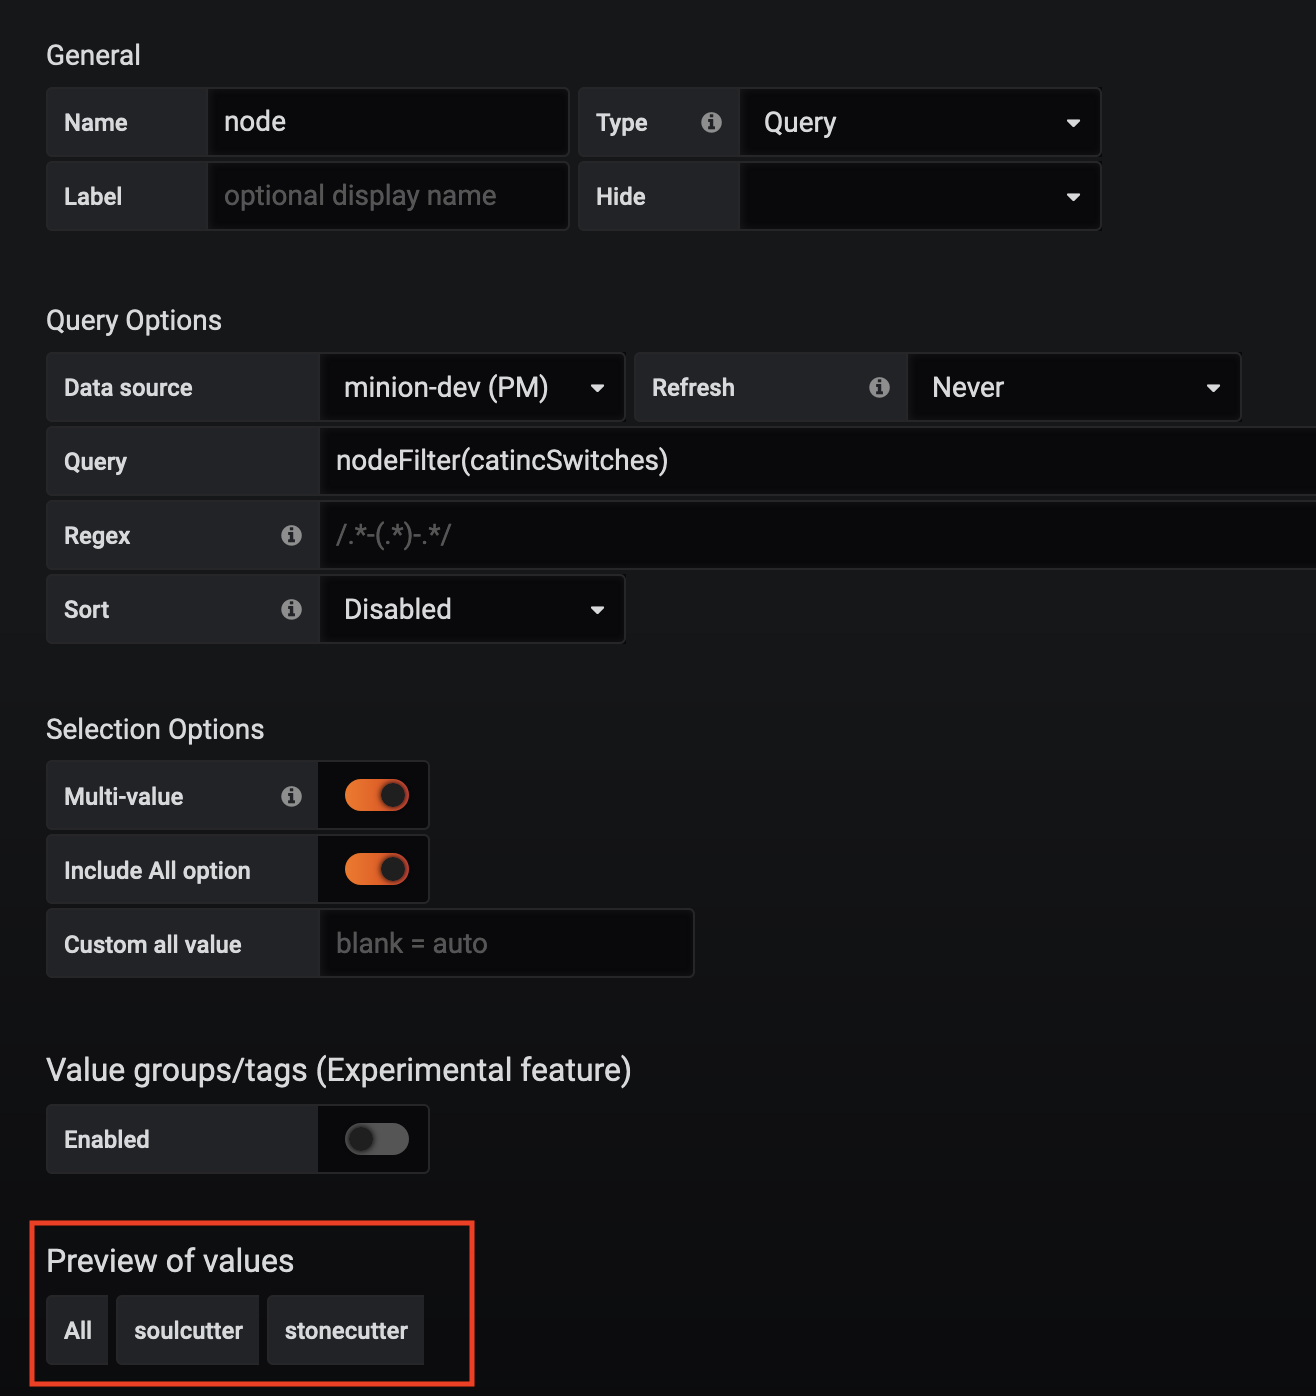
-
Supported queries are in the form
nodeFilter($filter)ornodeResource(FS:FID), where$filteris any filter expression. In this case, we used thenodeFiltervariable to specify the nodes in the "switches" category.
-
-
Click Add, then click Save.
For more examples of template variables in queries, import the OpenNMS Network Interfaces Report sample dashboard.
Specify a node variable in the panel
After you create a template variable, you must update your panel to make sure that data is available from all monitored nodes, rather than one specific node:
-
In the panel, type
$nodein the Node box. -
Type
nodeToLabel($node)in the Label box to make it unique. Note that a label must be unique to display data in the panel.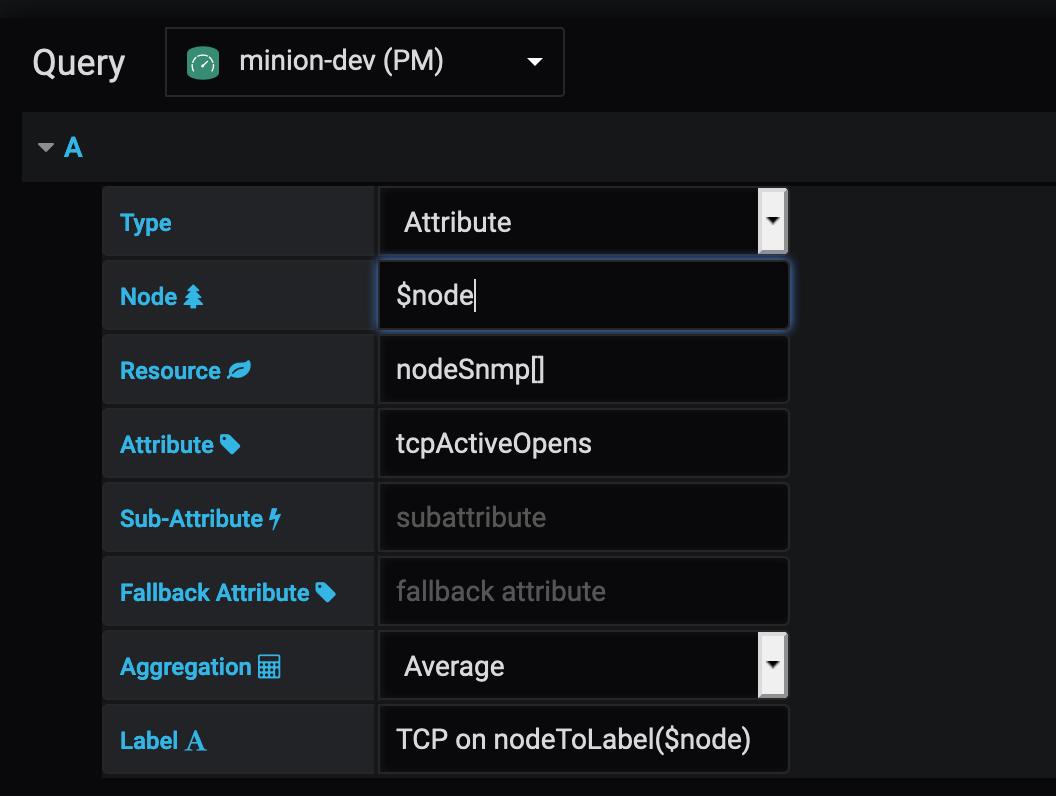
-
Click Save.
-
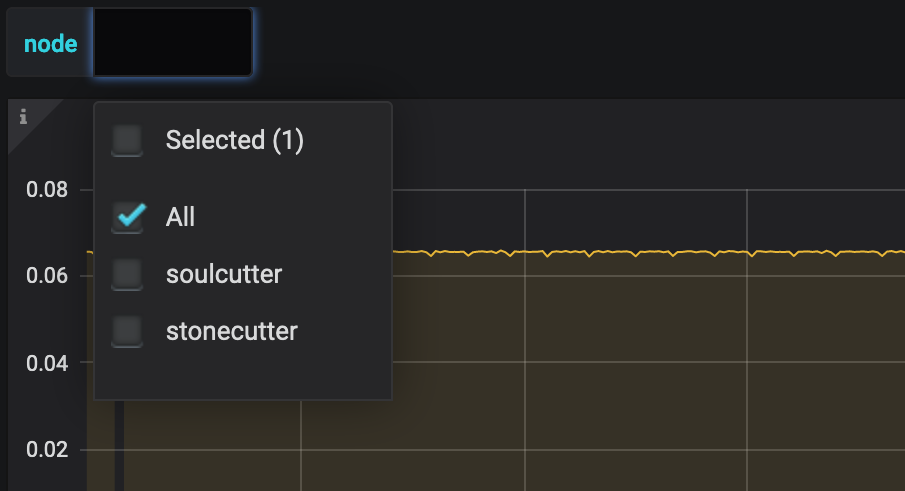
Select the nodes whose data you want to display from the Node list:
Template variable syntax
If the template variable is used in an expression, you can use $node syntax if the variable is
a separate word (surrounding by whitespace).
If the variable is being used as part of an expression and is not surrounded by whitespace,
then you must use ${node} syntax.
Given a template variable node, where the valid of node is currently 1:
| Status | Variable syntax | Result | Explanation |
|---|---|---|---|
Valid |
|
|
Single variable, alone or surrounded by whitespace |
Valid (but not preferred) |
|
|
Variable interpolation, at end of a word |
Valid (preferred) |
|
|
Variable interpolation, explicit and unambiguous |
Invalid |
|
error |
This will be an error since OPG interprets this as the template variable |
Valid |
|
|
Valid and unambiguous variable interpolation |
Valid |
|
|
Valid and unambiguous variable interpolation |
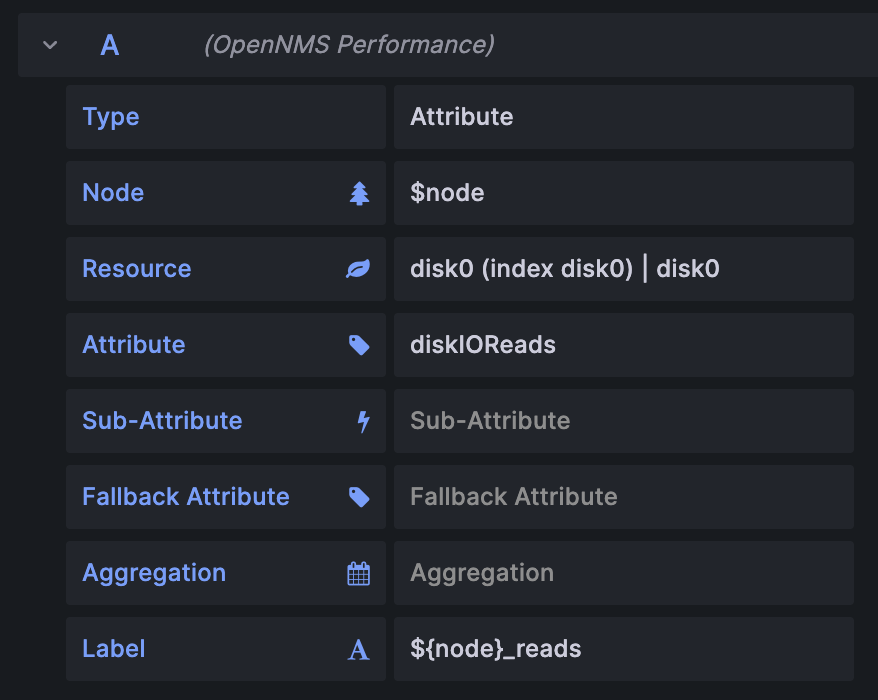
Example:
If you want to display the disk IO reads for various nodes using a template variable, and also display
the label in the Grafana graph as 1_reads, 61_reads, etc., you can set
the variable to $node and the label to ${node}_reads.
Create a filter panel
Filter panels let you configure a series of variables by which to filter data on a dashboard. While template variables work with the Performance datasource, the filter panel coordinates with any panels on the dashboard that use an Entities datasource to automatically apply filters that match those variables.
Before you create a filter panel, make sure that you have a panel on your dashboard that uses an Entities datasource (see Create a panel). This example creates a panel that lets you filter on alarm type and alarms that are either acknowledged or in a situation.
To create a filter panel, follow these steps:
-
On your dashboard, click the Add Panel symbol.
-
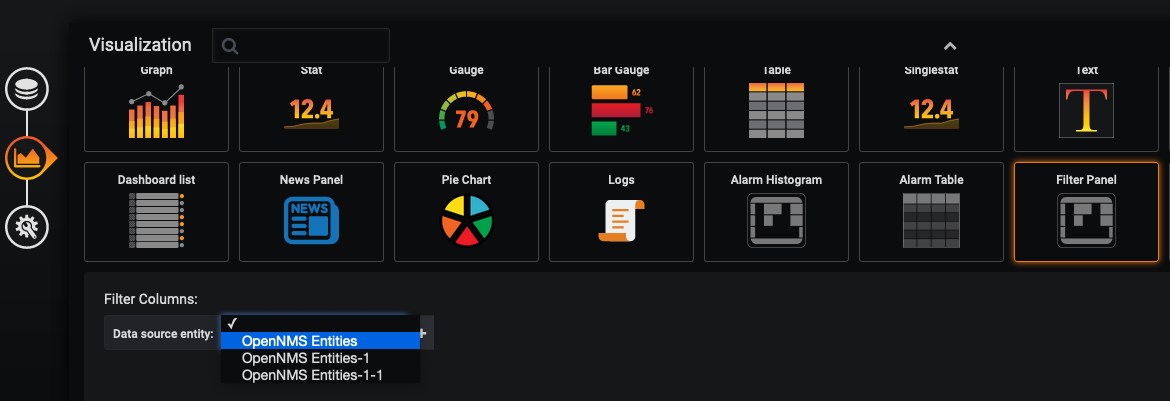
Click Choose Visualization and choose a Filter Panel.
-
Under Filter Columns, choose an Entities datasource:
-
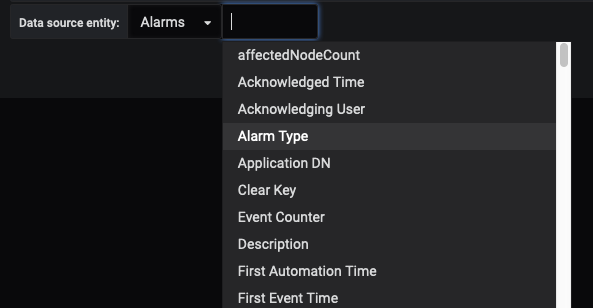
Choose Alarms or Nodes, as appropriate.
-
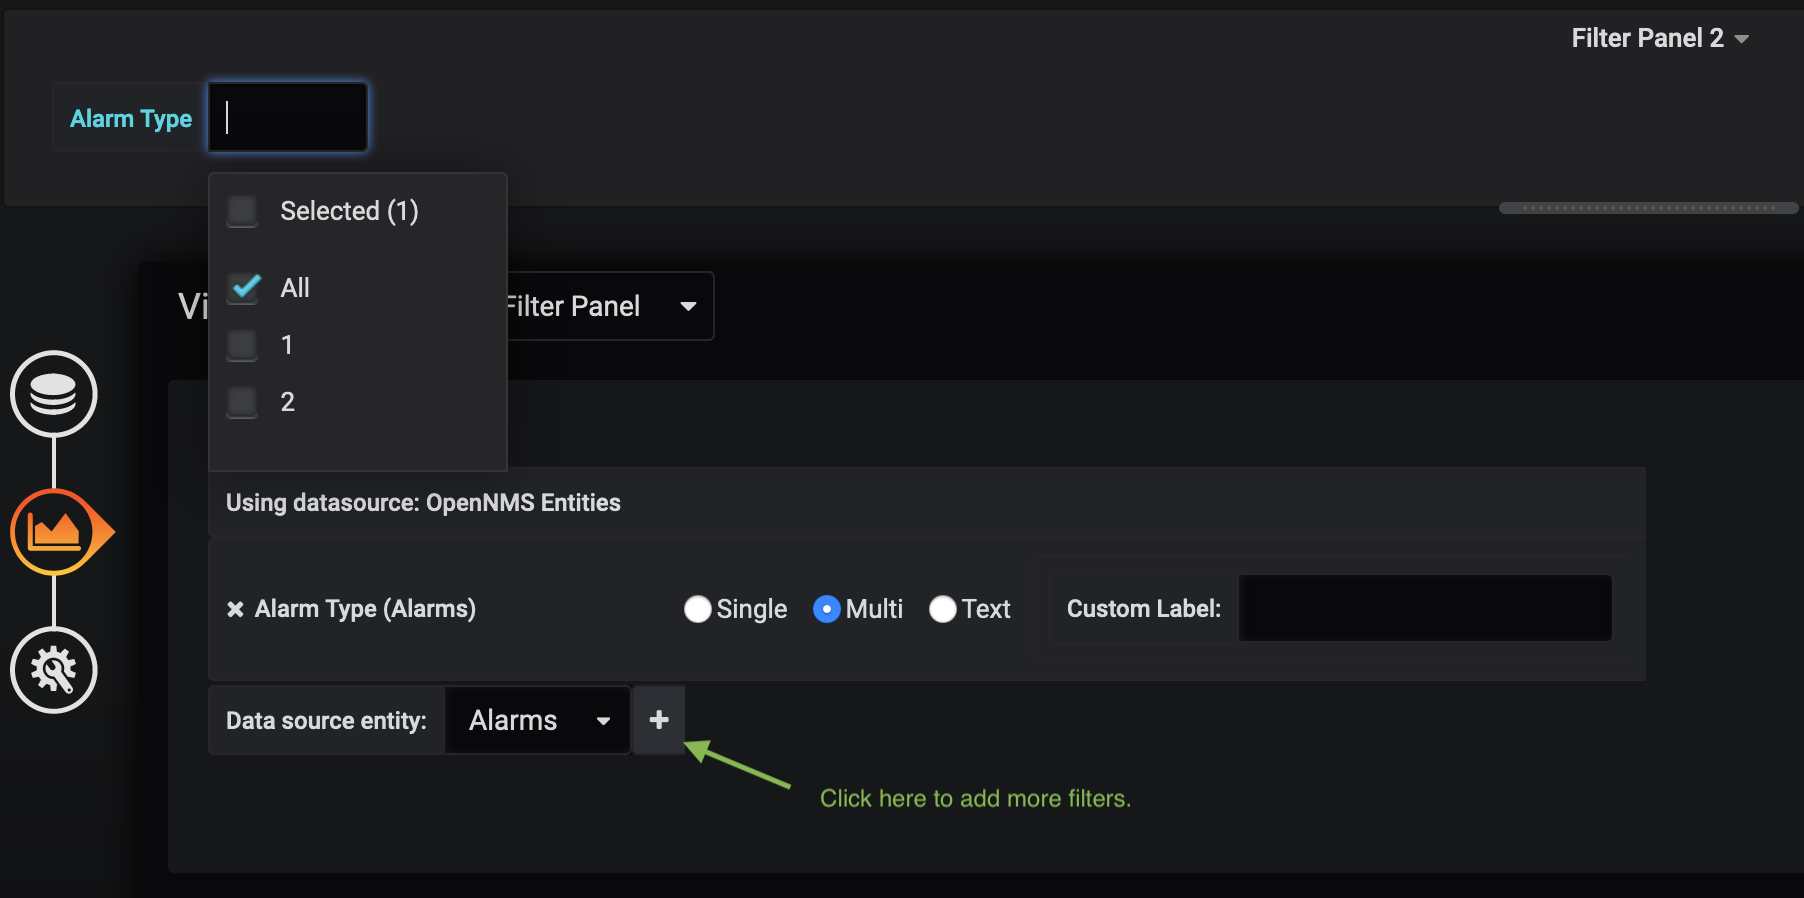
Click the plus symbol (+) and choose an attribute to filter on from the list (for example, Alarm Type, "Is Acknowledged"):
-
Specify information about the appearance of your filter field, including whether it is a drop-down list or a text field, and a custom label, as desired:
-
Repeat steps 4-7 to add additional filters, as desired.
-
In the left navigation menu, click the General symbol to change the name of the filter panel and specify additional information.
-
Click the Save Dashboard symbol at the top-right of the panel.
The filter panel is displayed on your dashboard:
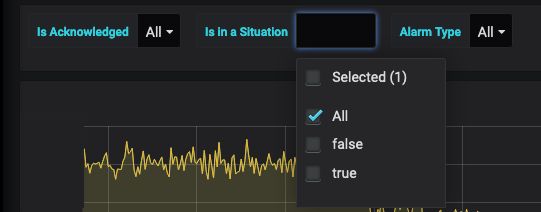
All panels on the dashboard that use an Entities datasource will be updated as you modify the values in the filter panel. You can drag the panel to appear anywhere on your dashboard.