Plan Your Dashboard
Every network is unique, and each has different monitoring requirements. The OpenNMS Plugin for Grafana has the flexibility to let you customize dashboards to display data in a way that best meets your needs and workflow.
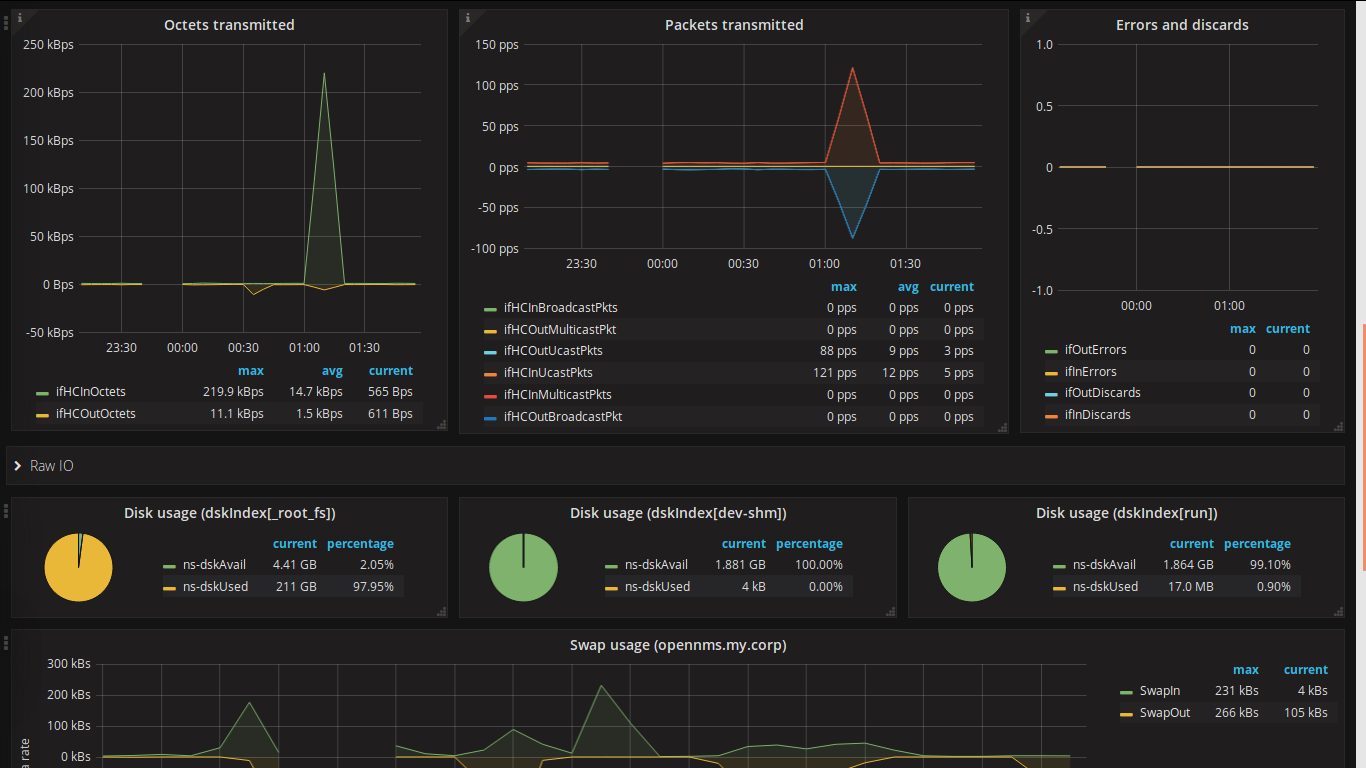
The plugin’s dashboards display multiple panels, each of which visualizes specific data. For example, this sample dashboard displays performance metrics collected through SNMP:
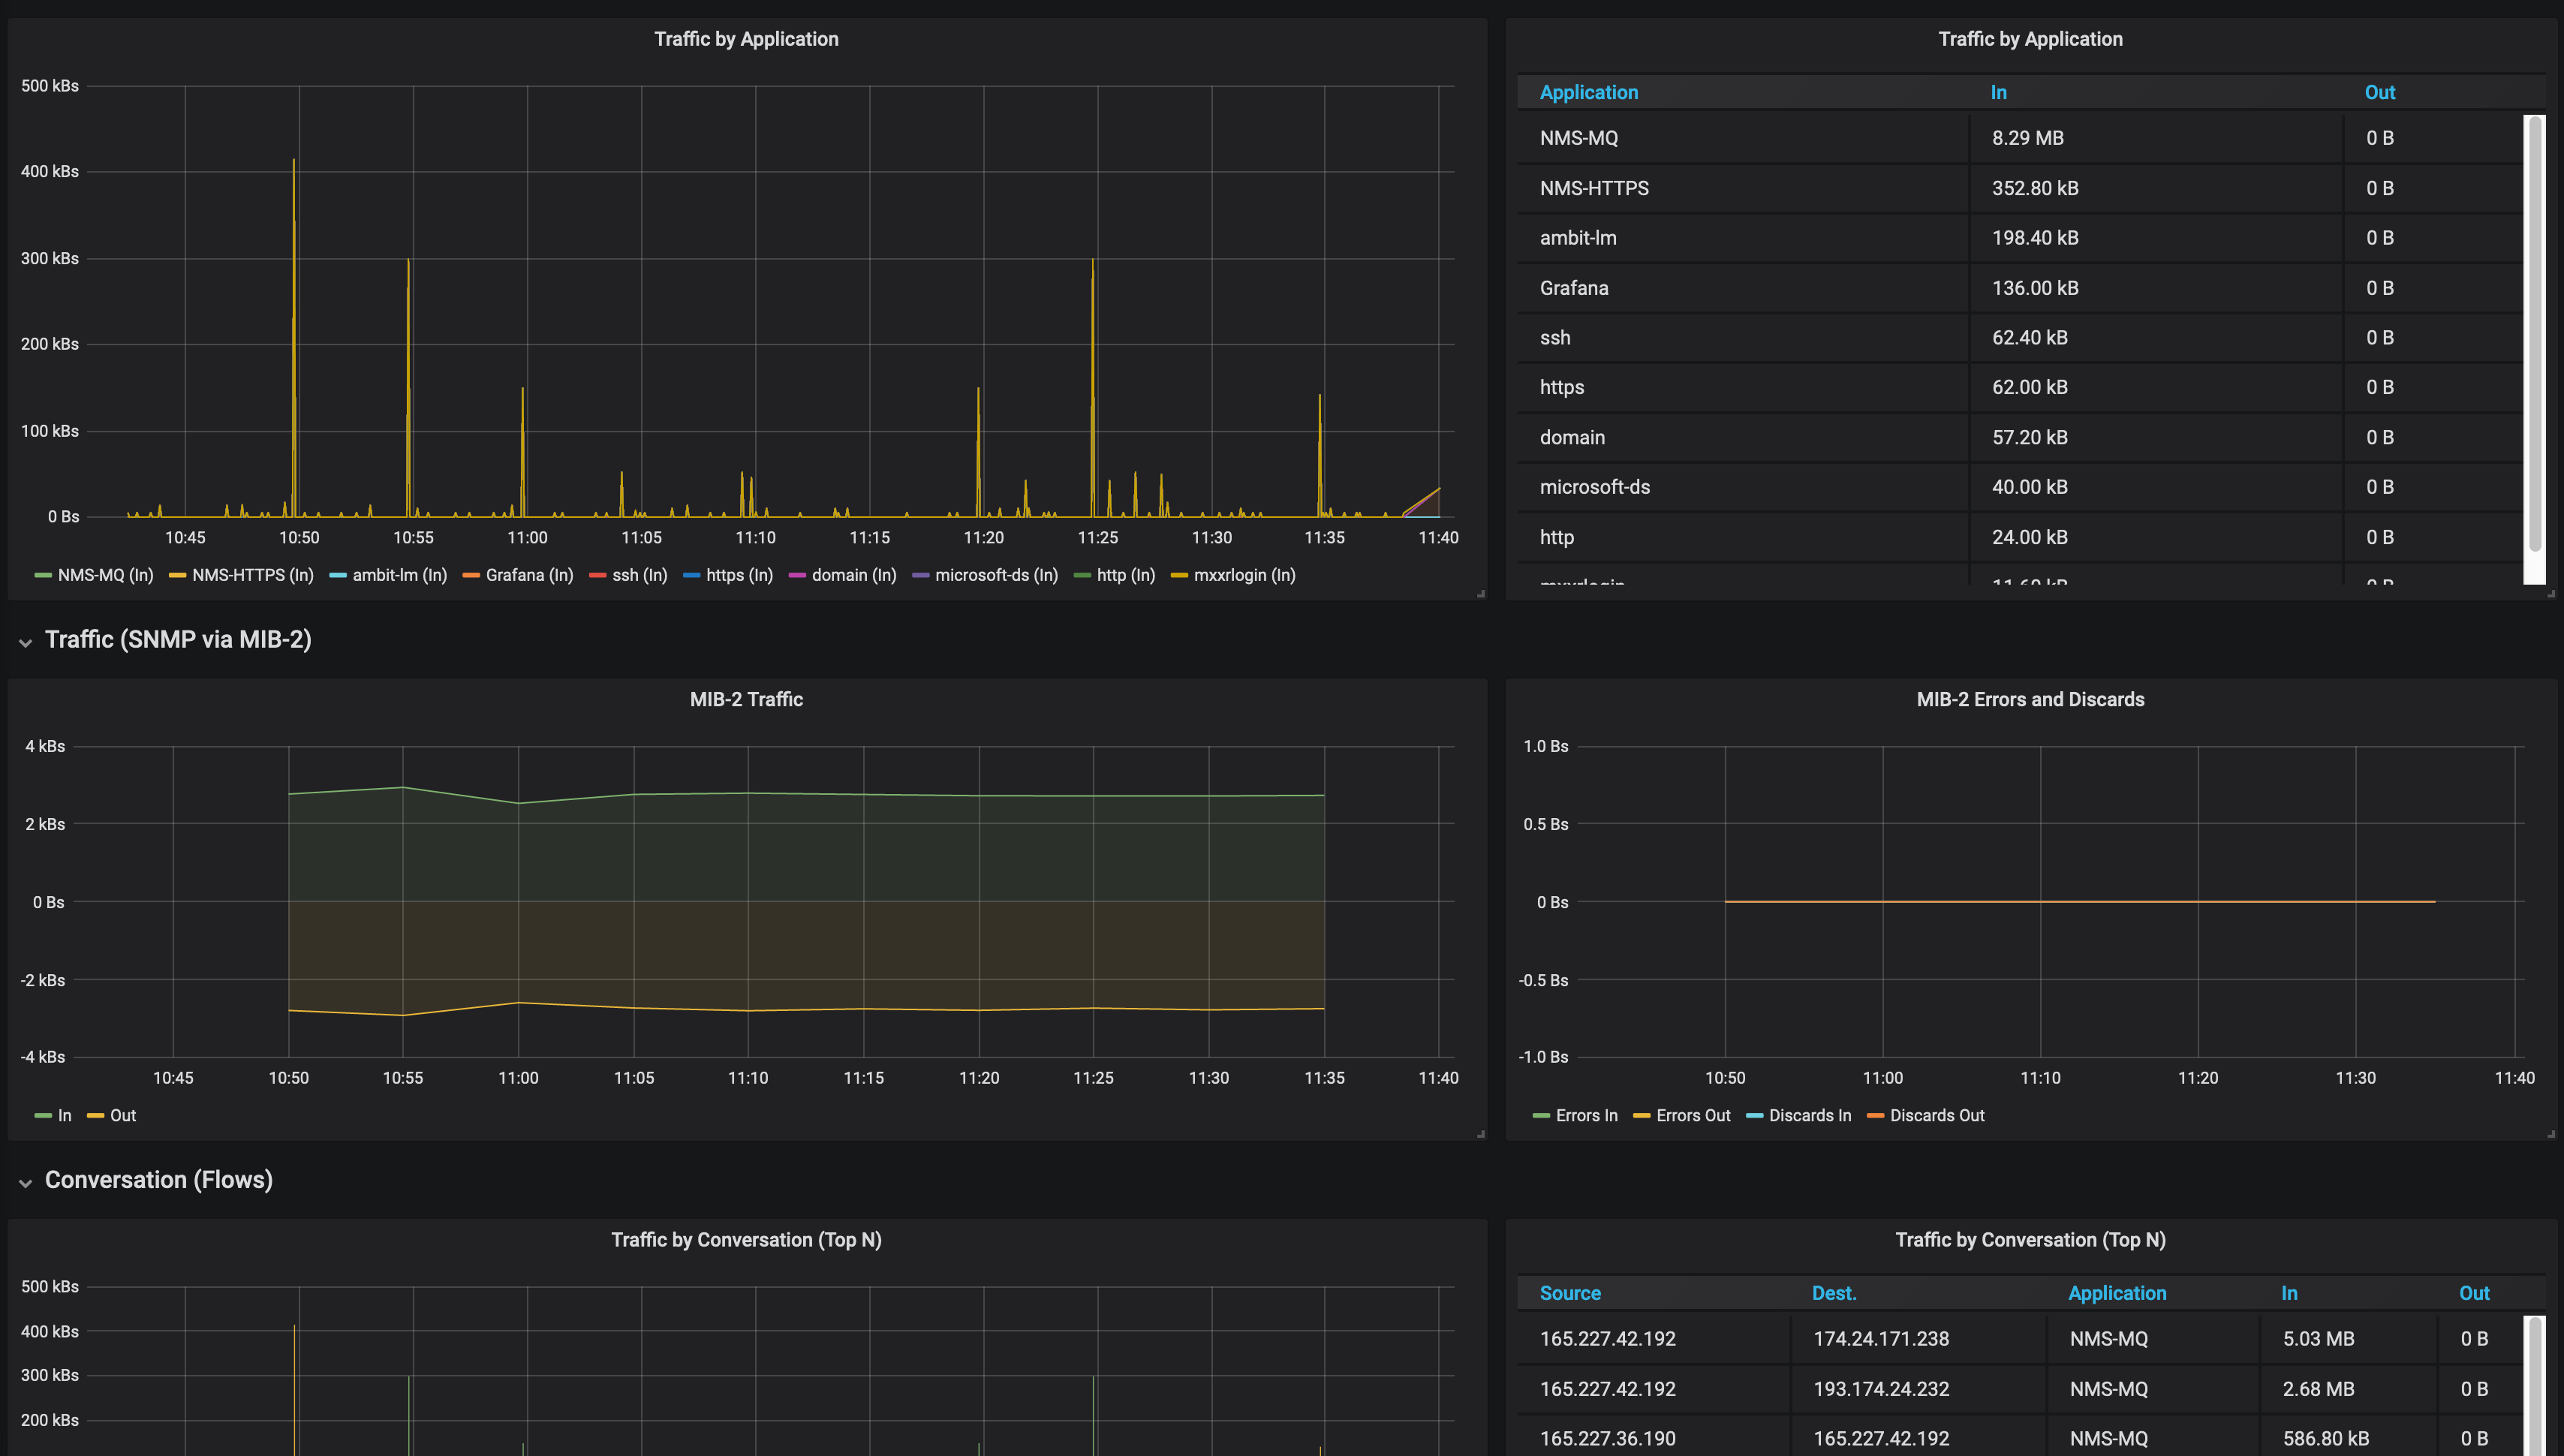
Another dashboard might display traffic flows:
Taking the time to consider what data you want to visualize and how to organize it can save you time and effort when you create dashboards. When planning your dashboard, consider the following points:
-
What type of data you want to visualize (faults, performance, flows, inventory, and so on).
-
What is your workflow?
-
What is the best way to organize the data?
-
Who is responsible for specific tasks?
-
How are issues addressed in your environment?
-
Who should have access to specific data?