Predefined Dashboards
You can import a number of official and community-built OpenNMS Plugin for Grafana dashboards. They display the following data points, among others:
-
SNMP data collected by Linux hosts.
-
Business service availability.
-
Cassandra performance.
-
Generic UPS statistics.
-
Network interfaces.
You can edit predefined dashboards to meet your needs, or to learn more about how to build your own dashboards.
Import a dashboard
Follow these steps to import a dashboard:
-
Navigate to the official Grafana Dashboards page and search for "OpenNMS."
-
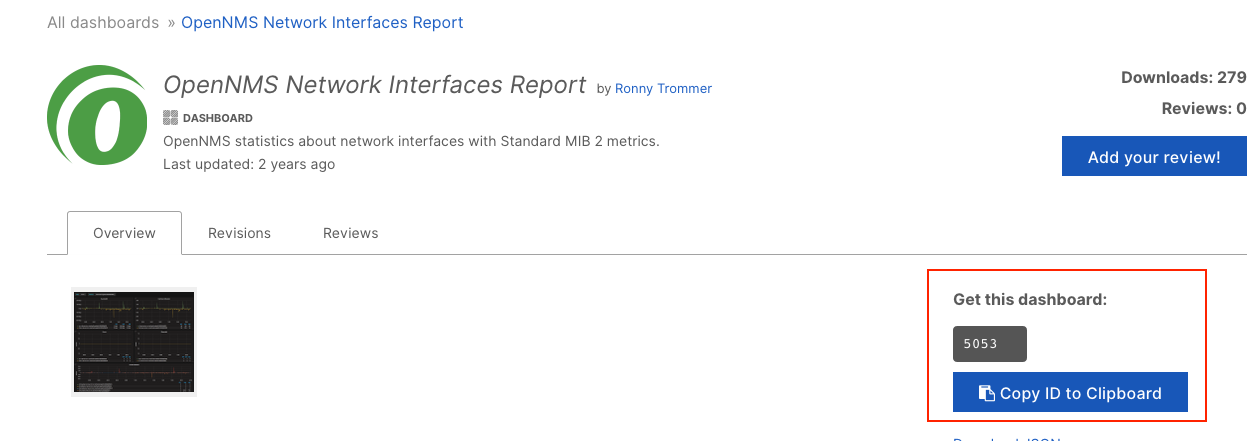
Select the dashboard that you want to import.
-
Copy the dashboard’s ID:
-
Navigate to your Grafana home page and click the plus symbol (+) in the left navigation menu.
-
Select Import. The Import page is displayed.
-
Update the information as desired and click Import.
You must specify a flow and performance datasource.
The dashboard is displayed. To view a list of your dashboards, click .
| Predefined dashboards created before April 2023 require conversion before you can use them with OpenNMS Plugin for Grafana. You must export and convert these dashboards before using them. |