Create a Dashboard
This section demonstrates how to create a simple dashboard using the OpenNMS Plugin for Grafana.
You must have the following set up to create a dashboard:
-
An instance of Grafana with the plugin installed.
-
An instance of OpenNMS that is reachable from your Grafana instance.
-
One or more nodes being monitored by OpenNMS.
If you already use the OpenNMS Data Source plugin with Grafana, see Migrate from OpenNMS Data Source Plugin for information on how to switch to the OpenNMS Plugin for Grafana.
Set up the plugin
After the plugin is installed in your Grafana instance, you must enable it to allow access to the included datasource and panel options.
-
Navigate to the home page of your Grafana instance.
-
In the left navigation menu, select :
-
Select OpenNMS Plugin for Grafana.
-
If the plugin is not listed, try restarting your Grafana server.
-
If the issue persists, make sure the plugin’s files are in the Grafana plugins directory (default:
var/lib/grafana/plugins).
-
-
Click the Enable or Enable plugin button.
The Disable option indicates that the plugin is already enabled. You can also choose Update to download the latest version of the plugin via Grafana’s plugin repository.
Create a datasource
The type of data that you can display in a dashboard depends on the datasource that you select.
Before you create a dashboard, you must set up the datasource (performance, flow, or entity). For this walk-through, we will configure a entity datasource. After completing these steps, repeat the same process to configure a performance datasource, and optionally a flow datasource if you are collecting flow data.
You need to configure only the URL, Basic Auth, and Basic Auth Details (username and password) fields. See the official Grafana documentation for information on configuring other fields.
Follow these steps to set up a datasource:
-
Navigate to the home page of your Grafana instance.
-
In the left navigation menu, select .
-
Select Add New Data Source.
-
In the Search box, type OpenNMS Entities.
-
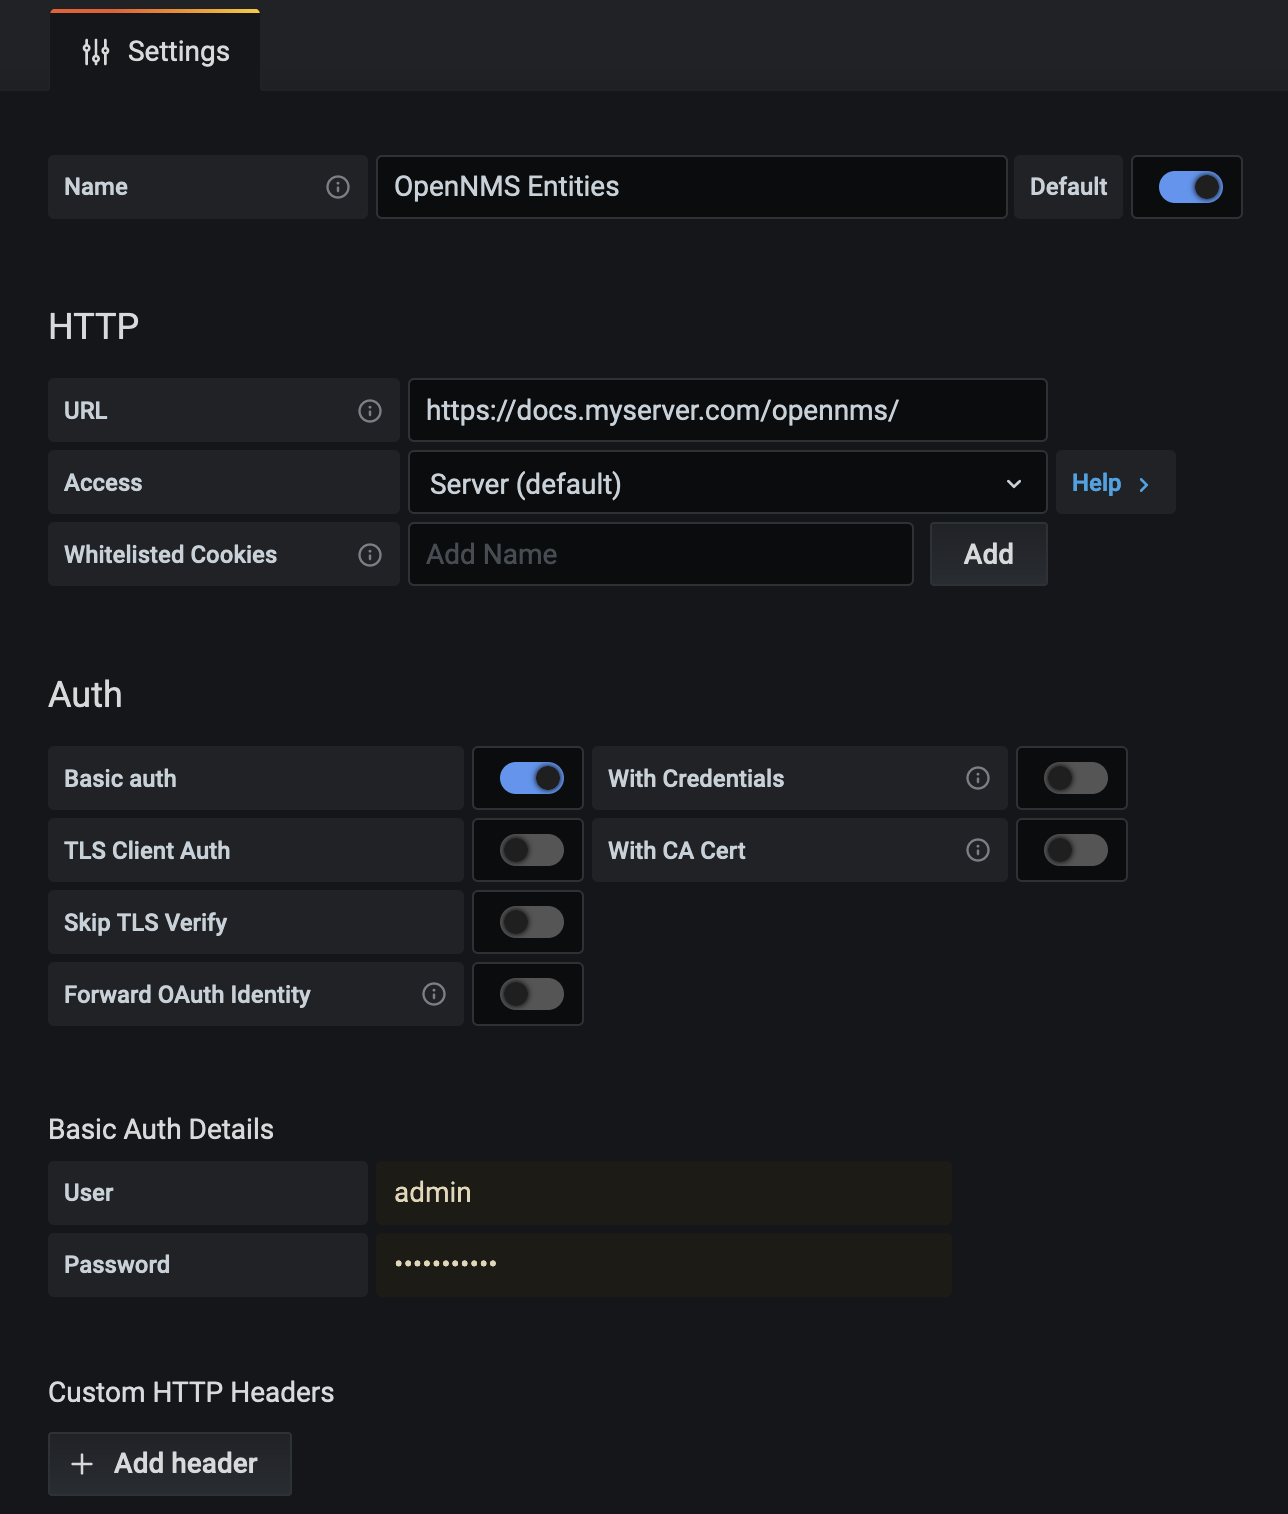
Select the OpenNMS Entities datasource. The settings dialog is displayed:
-
Type the URL that directs to your OpenNMS instance (for example,
http://localhost:8980/opennms). In most cases, this URL should end with/opennms. -
Under Auth, toggle Basic Auth on.
-
Enter the credentials for an OpenNMS user in the User and Password boxes.
-
Click Save & Test. A success message should be displayed.
-
If the message indicates a failure, review the information that you entered and click Save & Test to retest the settings.
-
Create a dashboard
For this walk-through, we will create a dashboard with an alarms table. For information on displaying other data in a dashboard, see Create a panel.
-
In the left navigation menu, click Dashboards.
-
Click .
-
Click Add Visualization.
-
Choose your data source (for example, OpenNMS Entities).
-
Configure its settings in the lower half of the page:
-
Select the datasource that you created in Create a datasource from the Query list.
-
In the Select list, choose Alarms.
-
(Optional) Configure additional information and add filters.
-
(Optional) Click + Query to add a query to the dashboard.
-
-
Under Panel Options, type the dashboard’s name in the Title box.
-
Under Visualization, select Alarm Table.
-
(Optional) Customize the graph by specifying settings under Panel Options.
-
-
Click the Save symbol at the top-right of the dashboard.
-
Type a name for the dashboard, and click Save.
Your dashboard should now be displayed. To test it, you can change the time range at the top-right of the page, or right-click an alarm to perform custom actions against it.
You can create more panels to display other data, or import an existing dashboard for design examples.
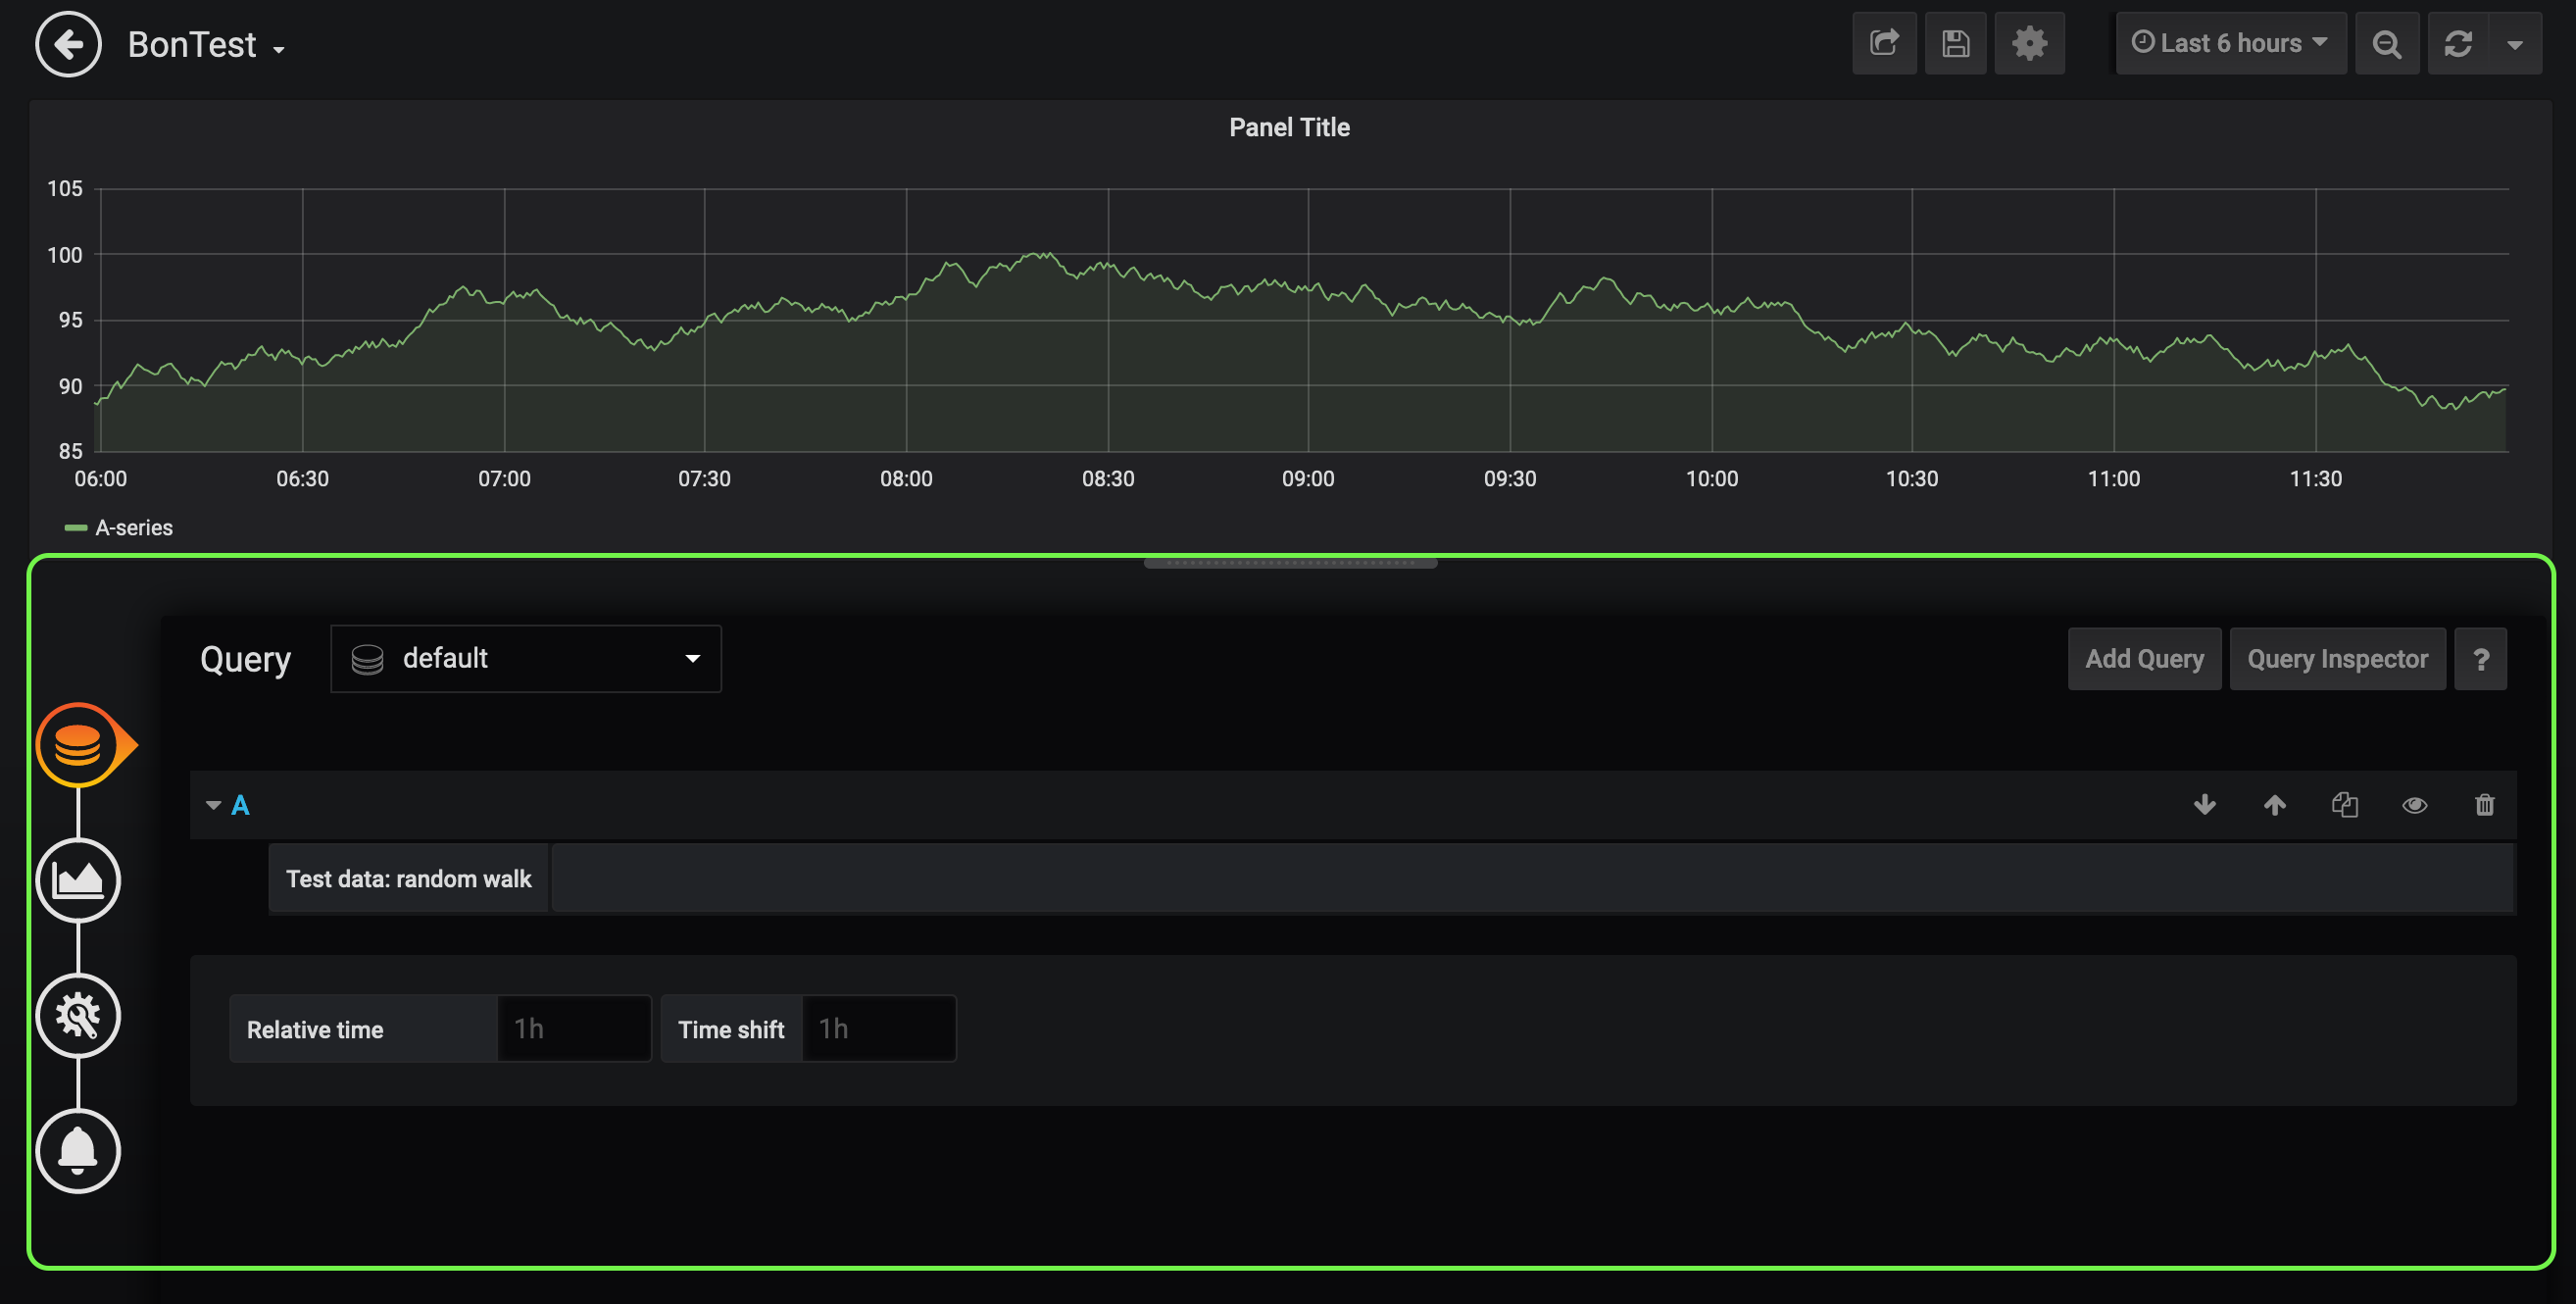
Create a panel
A panel is a component of a dashboard; it displays your specified fault and performance management data.
Before you add a panel to your dashboard, determine the type of data that you want to visualize (performance, metrics, alarms or nodes, and so on), and make sure that you have set up a datasource. Default graph types in Grafana work only with their appropriate datasource (for example, an alarm table visualization will not display data if a flow datasource is specified).
The plugin includes the following custom panels:
-
Alarm histogram
-
Alarm table
-
Filter panel
-
Flow histogram
For more information about custom panel types, see Default custom panels.
Follow the steps below to create a new panel in your existing dashboard:
-
Navigate to your dashboard and click the Add Panel symbol.
-
Click Add New Panel.
-
Select a datasource from the Query list.
-
(Optional) Configure additional settings. Options are dependent on the type of datasource selected.
-
-
Navigate to the Panel tab.
-
Under Visualization, click the Visualization symbol.
-
Click Graph. The graph is displayed at the top of the panel.
-
(Optional) Configure settings in the bottom half of the panel to customize the graph.
-
-
Specify the panel’s Name.
-
Click Save at the top-right of the panel.
Create an alarm panel
An alarm panel displays alarms from an entities datasource. Normally, visualization of the information in an entities datasource is done with tables.
Follow these steps to create a new alarm panel in your existing dashboard:
-
Navigate to your dashboard and click the Add Panel symbol.
-
Click Add New Panel.
-
Select an entity datasource from the Query list.
-
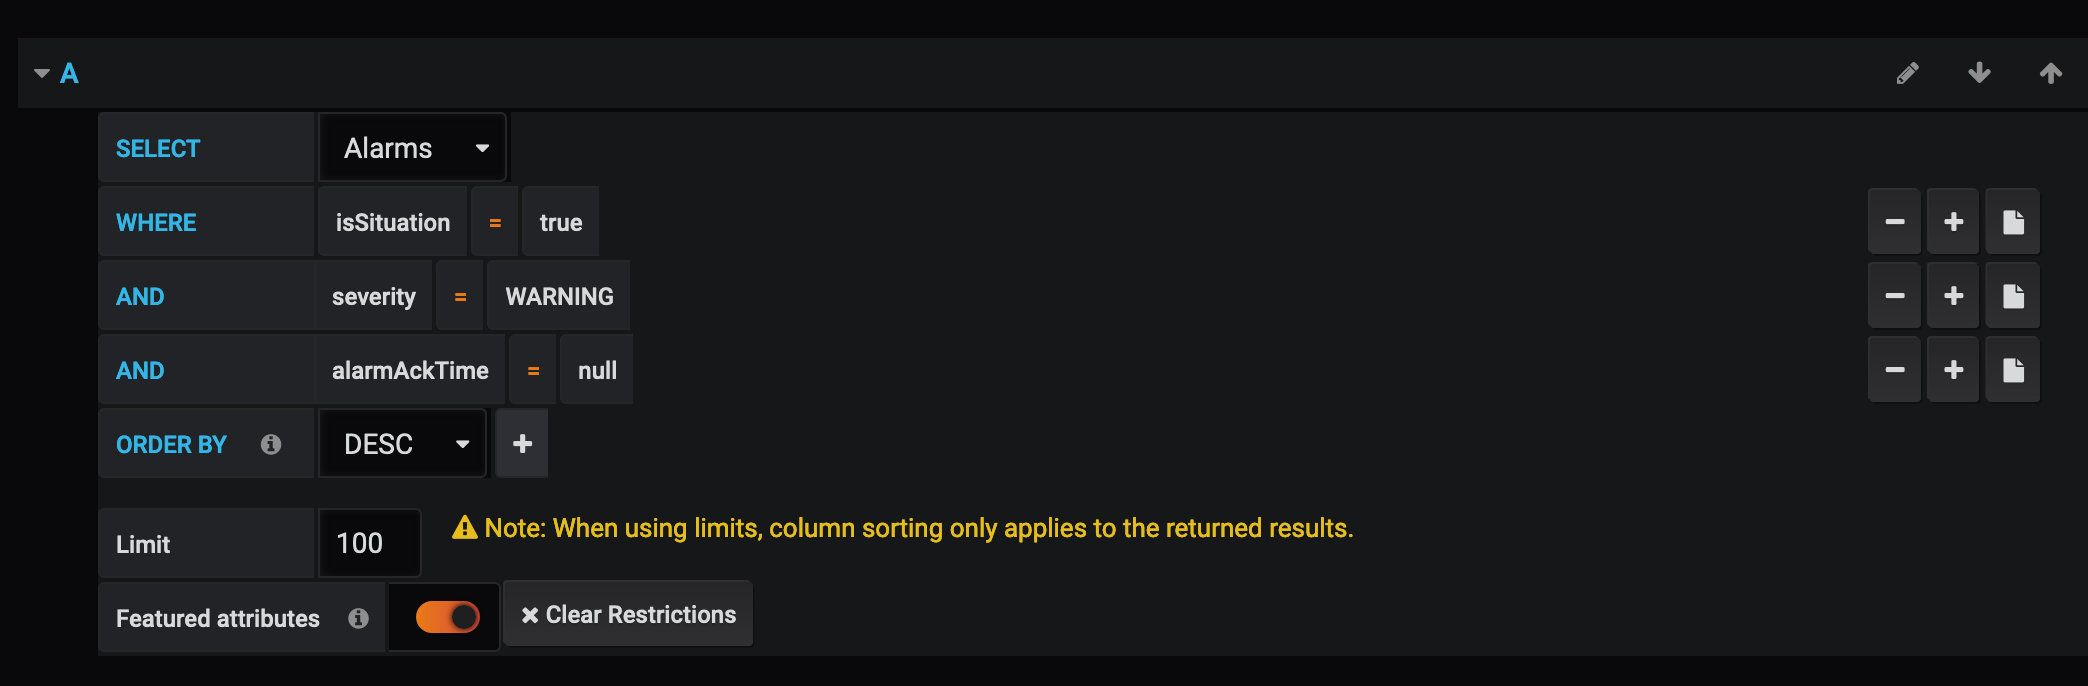
Choose Alarms from the Select list.
-
Set filters and conditions to specify the nodes and alarms to visualize.
-
Note that you can use nested "and/or" logic for the filters and conditions.
-
You can order alarms by ascending (oldest alarms first) or descending (most recent alarms first).
-
You can limit the number of alarms displayed.
-
You can toggle Featured Attributes on to display select attributes. Toggle it off to display all attributes in the drop-down lists.
-
-
Navigate to the Panel tab.
-
Under Visualization, click the Visualization symbol.
-
Select Alarm Table. The graph is displayed at the top of the panel.
You can choose a table or a histogram graph for alarms. For nodes, you can configure only a table graph. -
(Optional) Configure the settings in the bottom half of the panel to customize the graph.
-
-
Update the panel’s Name.
-
Click Save at the top-right of the panel.
Use data links to provide alarm context
Data links in Grafana let you create a user-defined operation (for example, a link to a node detail page or a knowledge base article, links based on alarm severity, and so on) that might help users diagnose an alarm. Once created, links that you can left-click on appear in the alarm table data. If you have configured more than one data link for the panel, left-clicking an item displays a context menu that lets you to choose which link to follow.
For example, you can create a data link with a URL of http://localhost:8980/opennms/alarm/detail.htm?id=${__data.fields.ID}.
The fields in the alarm table rows will appear as links and when clicked will go to that alarm detail URL.
Another example, http://localhost:8980/opennms/element/node.jsp?node=${__data.fields"Node ID"}' would go to the node detail for the alarm.
For information on how to create a data link, see the Grafana documentation.