Thresholding Tasks
For information on how to create a basic or expression-based threshold, see Step 5: Set up a Threshold in the Quick Start section. This section describes related thresholding tasks.
Use metadata in a threshold
Metadata in expression-based thresholds can streamline threshold creation. The Metadata DSL (domain specific language) lets you use patterns in an expression, whereby the metadata is replaced with a corresponding value during the collection process. A single expression can behave differently based on the node that it is tested against.
During evaluation of an expression, the following scopes are available:
-
Node metadata
-
Interface metadata
-
Service metadata
Metadata is also supported in the value, re-arm, and trigger fields for Single-DS and expression-based thresholds. For more information on metadata and how to define it, see Metadata.
Example
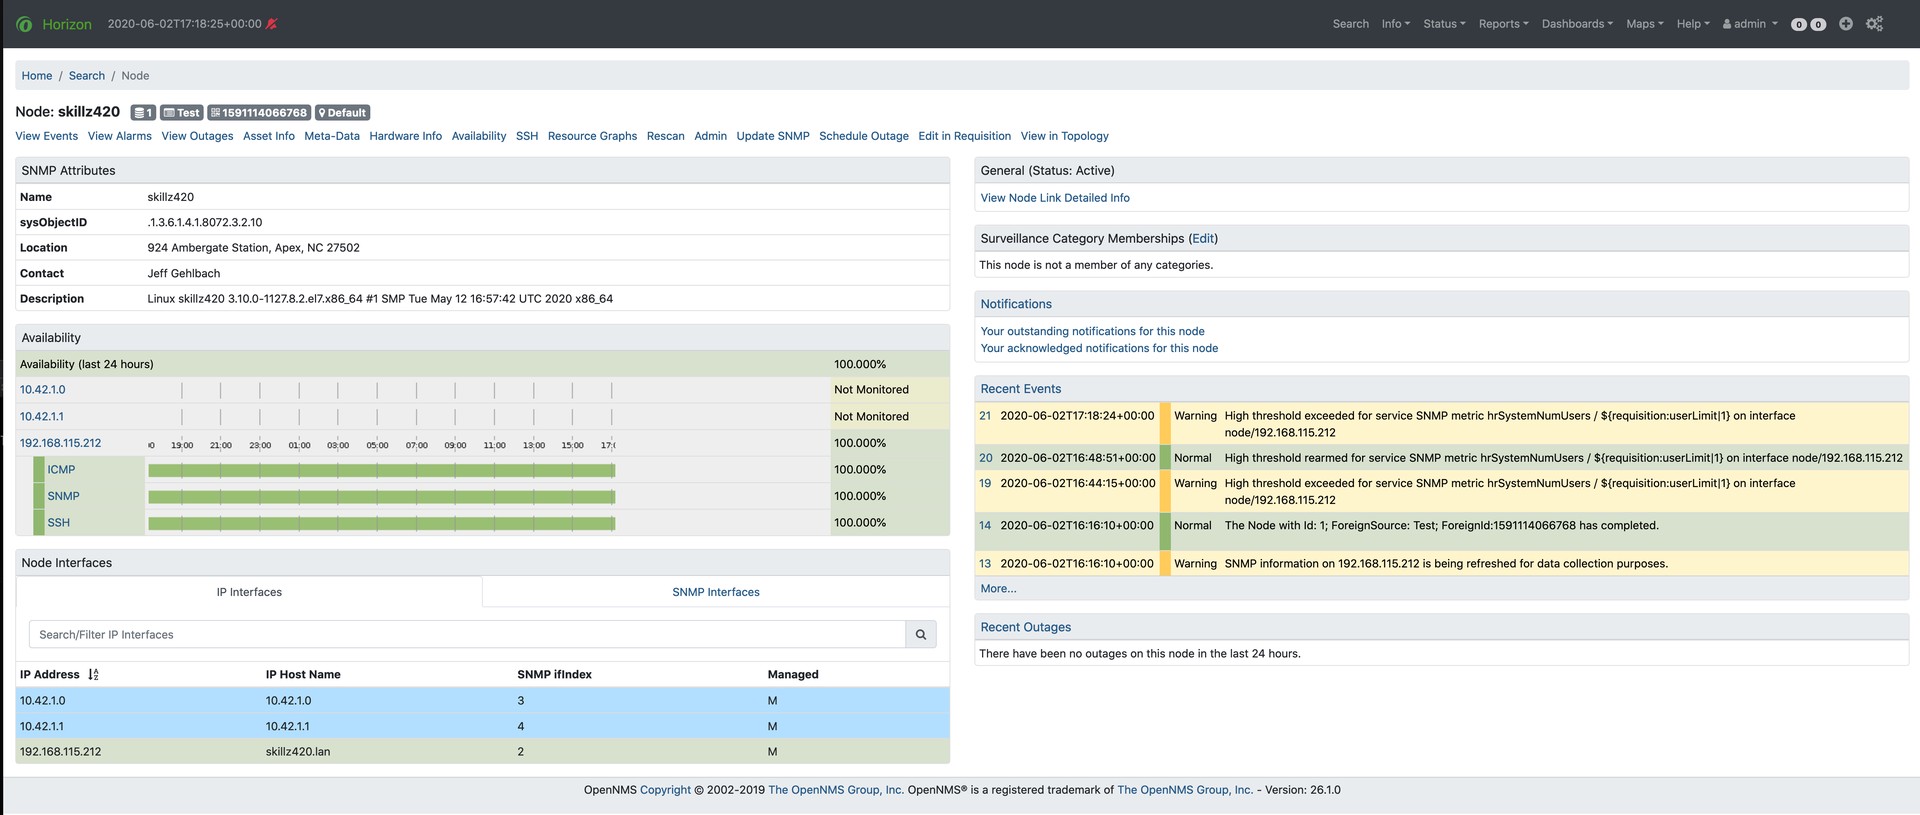
This procedure uses metadata to trigger an event when the number of logged-in users exceeds one.
The expression is in the form ${context:key|context_fallback:key_fallback|…|default}.
Before using metadata in a threshold, you need to add the metadata context pair—-in this case, a requisition key called userLimit (see Adding metadata through the web UI).
Follow these steps to create the expression-based threshold:
-
Click the gear symbol in the top-right of the screen.
-
Under Performance Measurement, click Configure Thresholds.
-
Click Edit beside the
netsnmpgroup. -
Click Create New Expression-based Threshold.
-
Fill in the following information:
-
Type: High
-
Expression:
hrSystemNumUsers / ${requisition:userLimit|1} -
Datasource type: Node
-
Value: 1
-
Rearm: 1
-
Description: Too many logged-in users
 Figure 1. Example expression-based threshold configuration
-
-
Click Save.
This expression will trigger an event when the number of logged-in users exceeds one.

Confirm that you are collecting metrics
Before creating a threshold, you should make sure that you are collecting the metric against which you want to threshold:
-
Choose .
-
Select one of the listed resources.
-
Under SNMP Node Data, select .
-
Scroll to find the graph for the metric you want to threshold.
You can click the binoculars symbol to display only that graph.
Determine the data source
Creating a threshold requires the name of the data source generating the metrics on which you want to threshold.
Data source names for the SNMP protocol appear in etc/snmp-graph.properties.d.
To determine the name of the data source, navigate to the Resource Graphs screen:
-
Choose .
-
Select one of the listed resources.
-
Under SNMP Node Data, select .
-
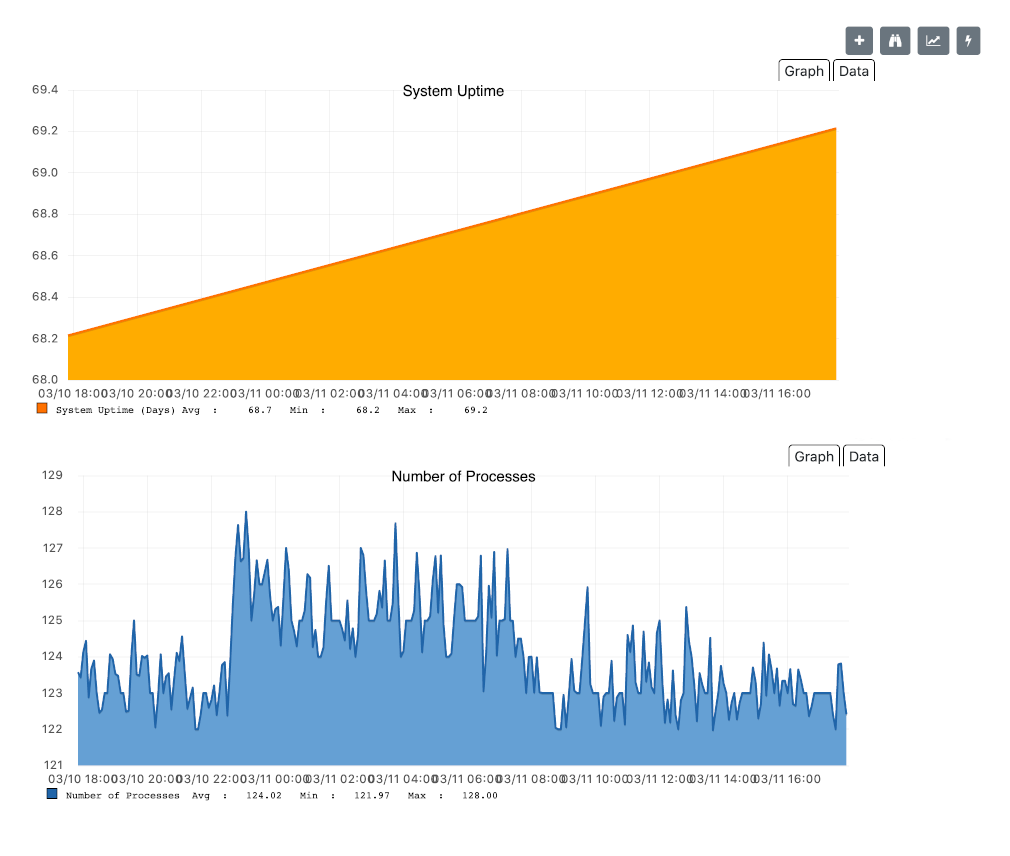
Scroll through the graphs to find the title of the graph that displays the metric on which you want to threshold. For example, "Number of Processes" or "System Uptime":
 Figure 3. Horizon performance data metric graphs
 -
Go to
etc/snmp-graph.properties.dand search for the title of the graph (for example, "System Uptime"). -
Note the name of the data source, and type it in the Datasource box when you create your threshold.