Import a Dashboard
There are a number of official and community-built dashboards available for import. They display the following data points:
-
SNMP data collected by Linux hosts
-
Business service availability
-
Cassandra performance
-
Generic UPS statistics
-
Network interfaces
-
And more …
You can edit these predesigned dashboards to meet your needs or to learn more about how to build your own dashboards.
To import an existing dashboard, follow these steps:
-
Go to the Grafana dashboards page and search for OpenNMS.
-
Click on the dashboard you want to import.
-
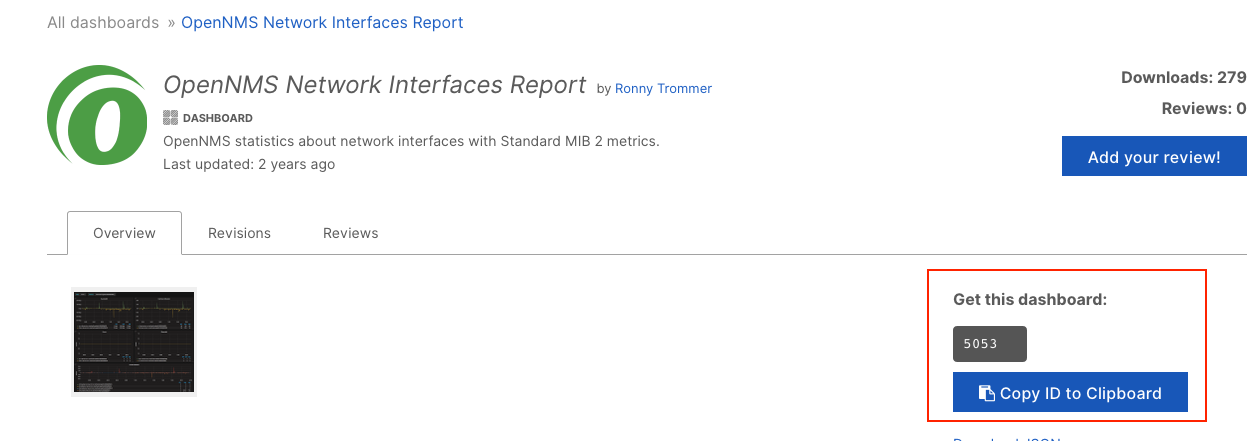
Copy the dashboard ID:
-
In HELM, click the plus sign (+) in the left menu and choose Import.
-
Type the dashboard ID in the Import via grafana.com field and click Load.
The Import screen appears.
-
Change information as desired and click Import.
You must specify a flow and performance data source.
The dashboard appears.
-
Click to view a list of your dashboards.