Creating Dynamic Dashboards
Instead of hard-coding specific information (such as node names or resource IDs) in a panel, HELM has several ways to create more dynamic and interactive dashboards:
Use variables to create dynamic dashboards
Template variables are available in metric queries and panel titles, and appear as a drop-down list at the top of the dashboard. Select from the list to filter the data the panel displays:
Each datasource has different template queries available. For example, the performance datasource has two available template queries:
-
specific node(s):
nodeFilter(NODEFILTERSTRING) -
specific resource(s) on a node:
nodeResources(NODEID[, id|label|name[, resource-type-name|*]])
See the following for entities datasource and flow datasource template queries.
This procedure explains how to use variables in a query for a category of nodes (switches):
-
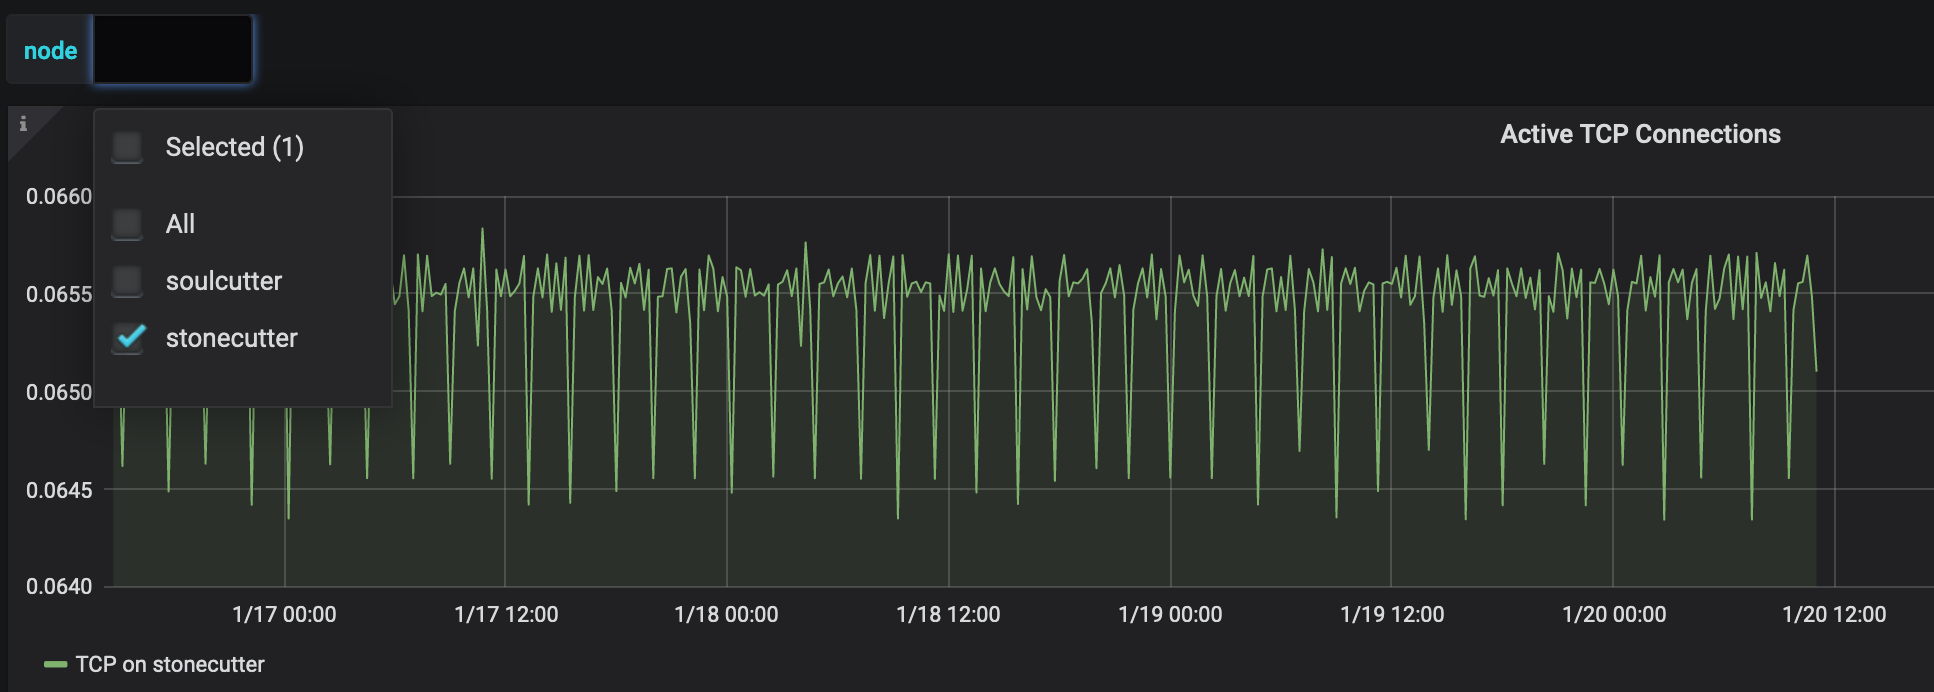
Select or create a panel. For this procedure, we created a panel that displays active TCP connections:
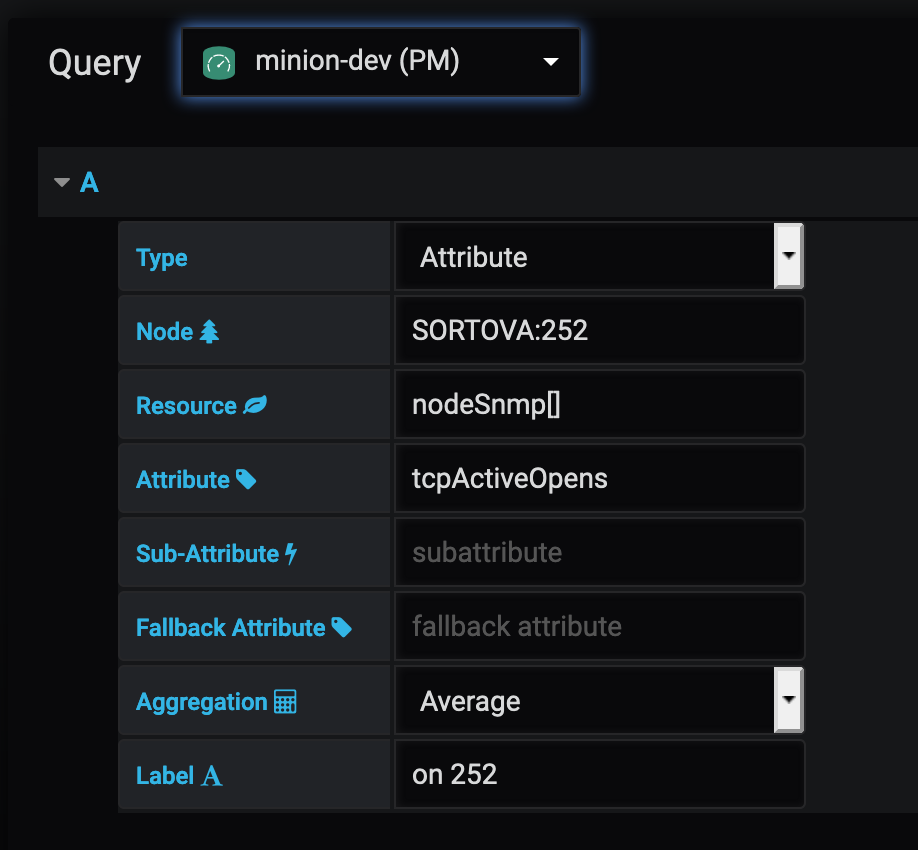
-
In the top-right of the panel, click the Dashboard Settings icon and choose .
-
Specify the appropriate information. A preview of the values returned appears at the bottom of the screen:
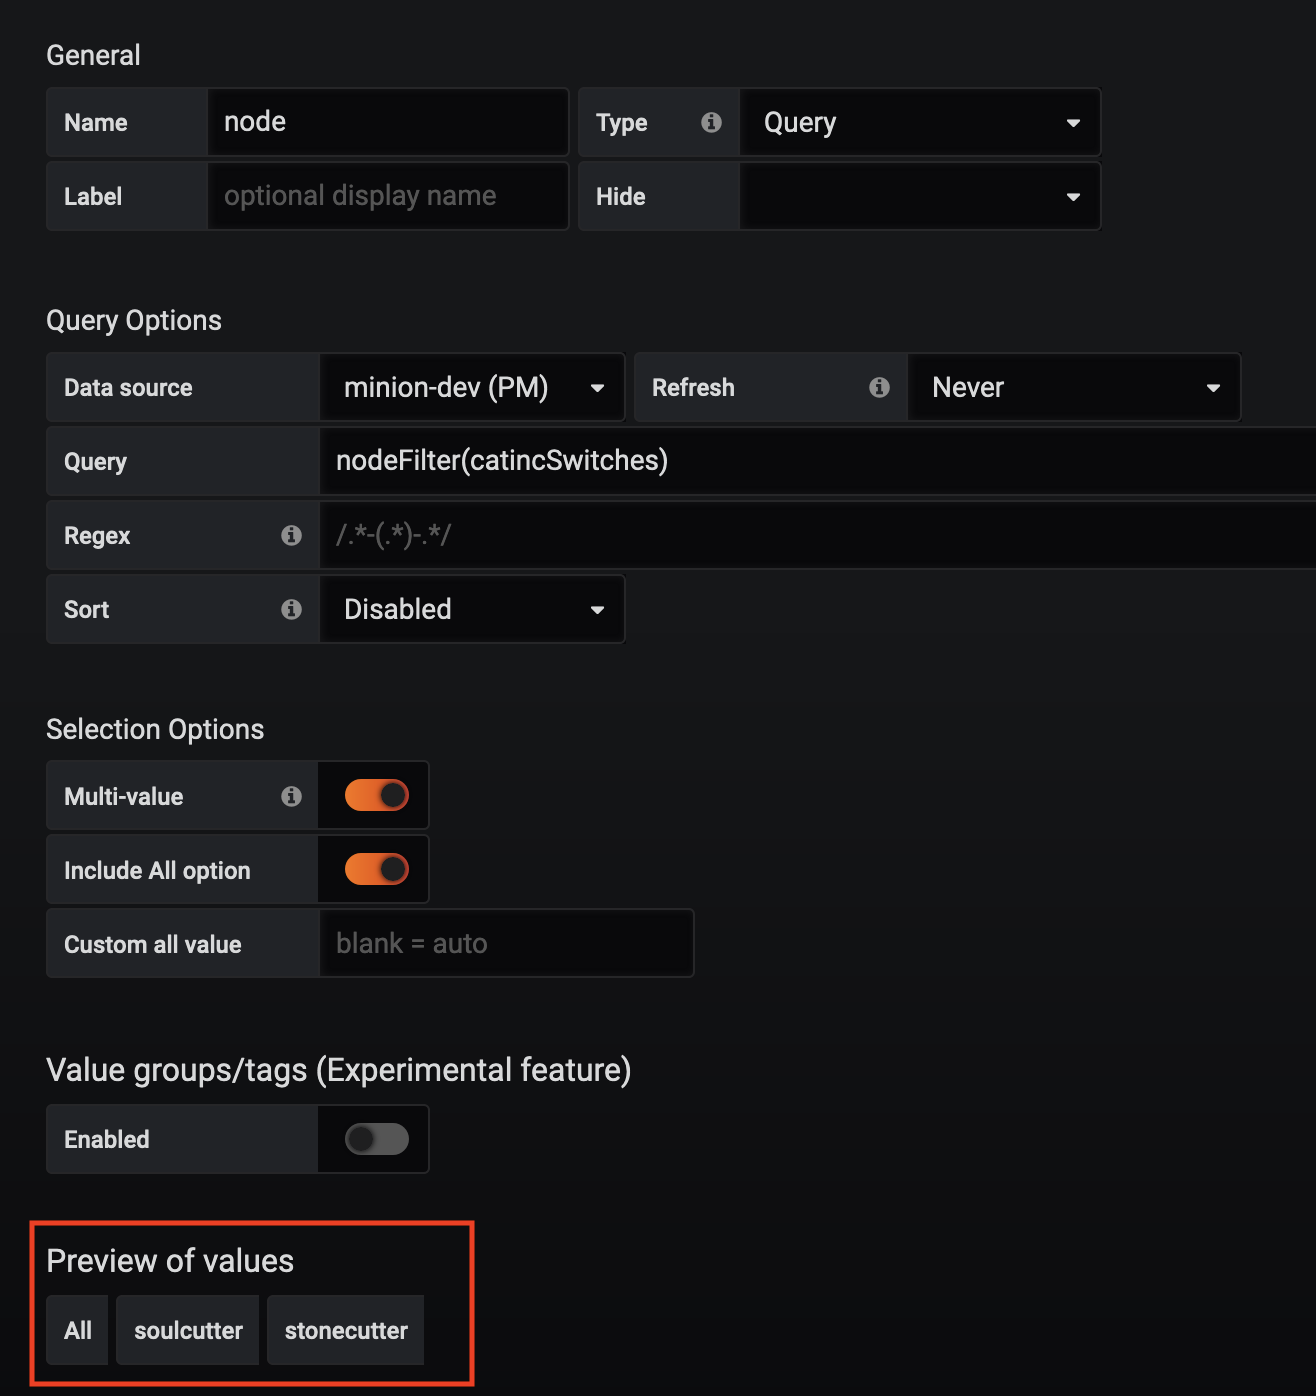
-
Supported queries are in the form
nodeFilter($filter)ornodeResource(FS:FID), where$filteris any filter expression. In this case, we used thenodeFiltervariable to specify the nodes in the "switches" category.
-
-
Click Add.
-
Click Save.
For more examples of variables in template queries, see the import the OpenNMS Network Interfaces Report sample dashboard.
Specify a node variable in the panel
After creating the template variable, you need to update the panel to make sure data is available from all the nodes rather than only one specific node.
-
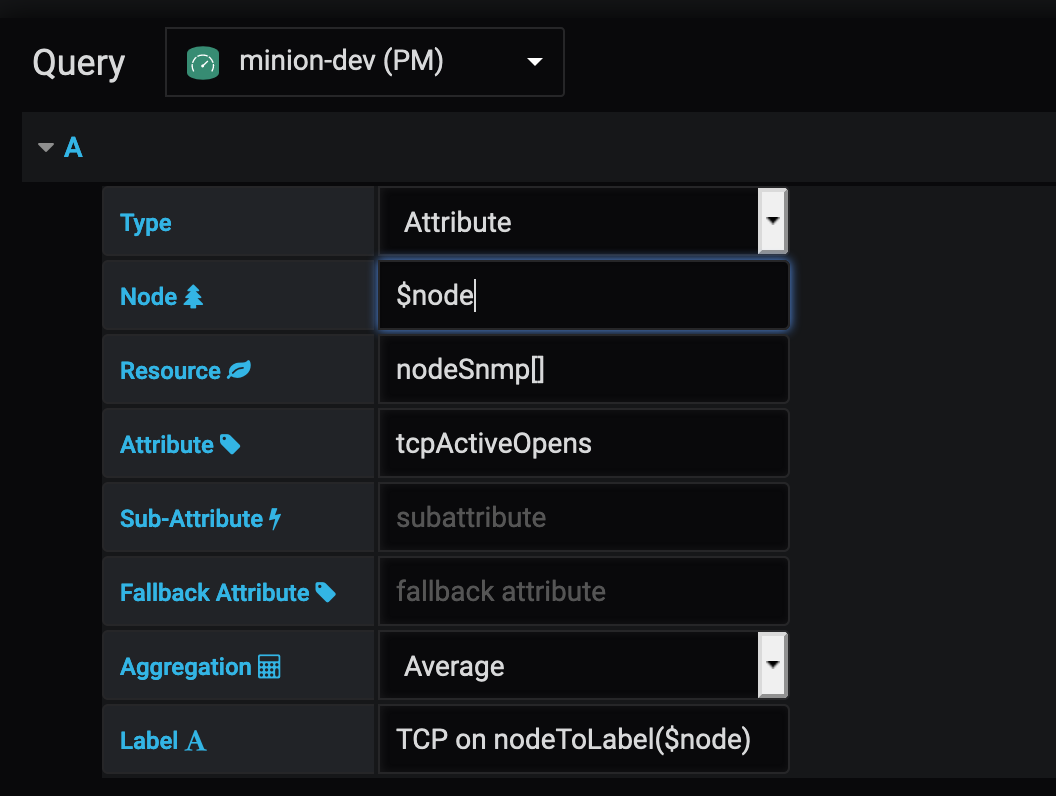
In the panel, type
$nodein the Node field. -
Update the label to make it unique by typing the following:
nodeToLabel($node).-
A label must be unique to display data in the panel.
-
-
Save your dashboard.
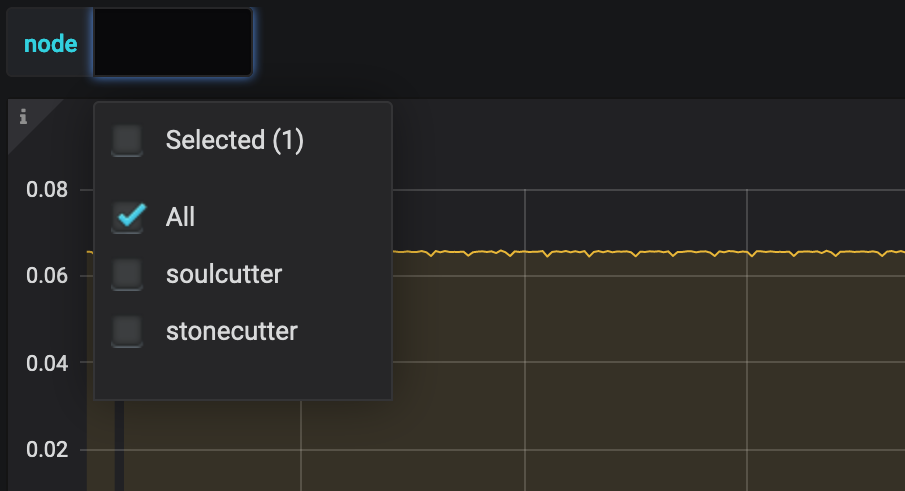
-
Click the Node drop-down you created to select the nodes whose data you want to display:
Create a filter panel
A filter panel lets you configure a series of variables to put on a dashboard. While template variables work with the performance datasource, the filter panel coordinates with any panels in the dashboard that use an entities datasource to automatically apply filters that match those variables.
Before creating a filter panel, make sure you have a panel on the dashboard that uses an entities datasource (see create a panel).
This procedure creates a panel that lets you filter on alarm type and alarms that are acknowledged or in a situation.
To create a filter panel, follow these steps:
-
In the dashboard, click the Add Panel icon.
-
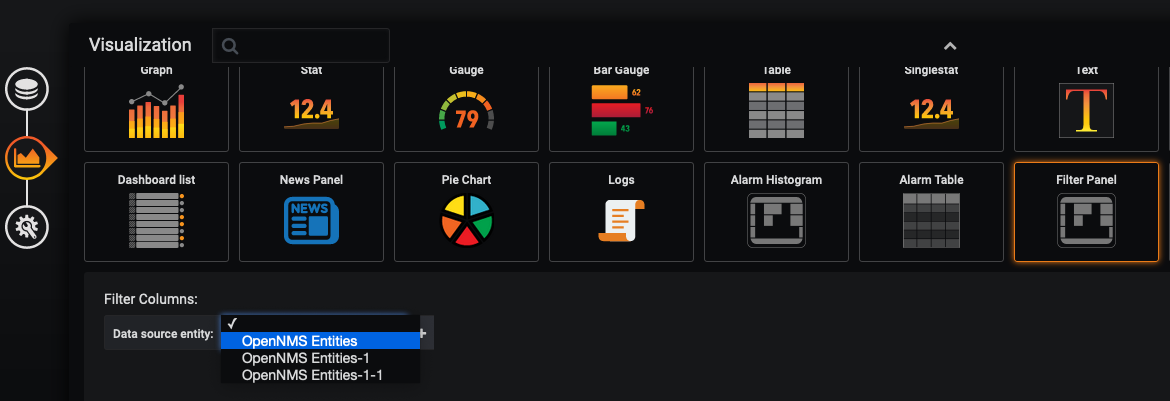
Click Choose Visualization and choose Filter Panel.
-
In the Filter Columns area, choose an entities datasource.
-
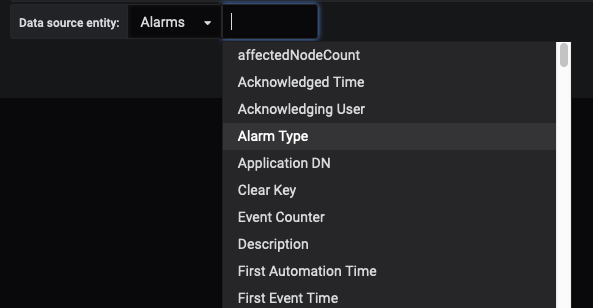
Choose Alarms or Nodes, depending on how you want to filter the data.
-
Click the plus sign (+) and choose an attribute to filter on from the list (for example, Alarm Type, "Is Acknowledged"):
-
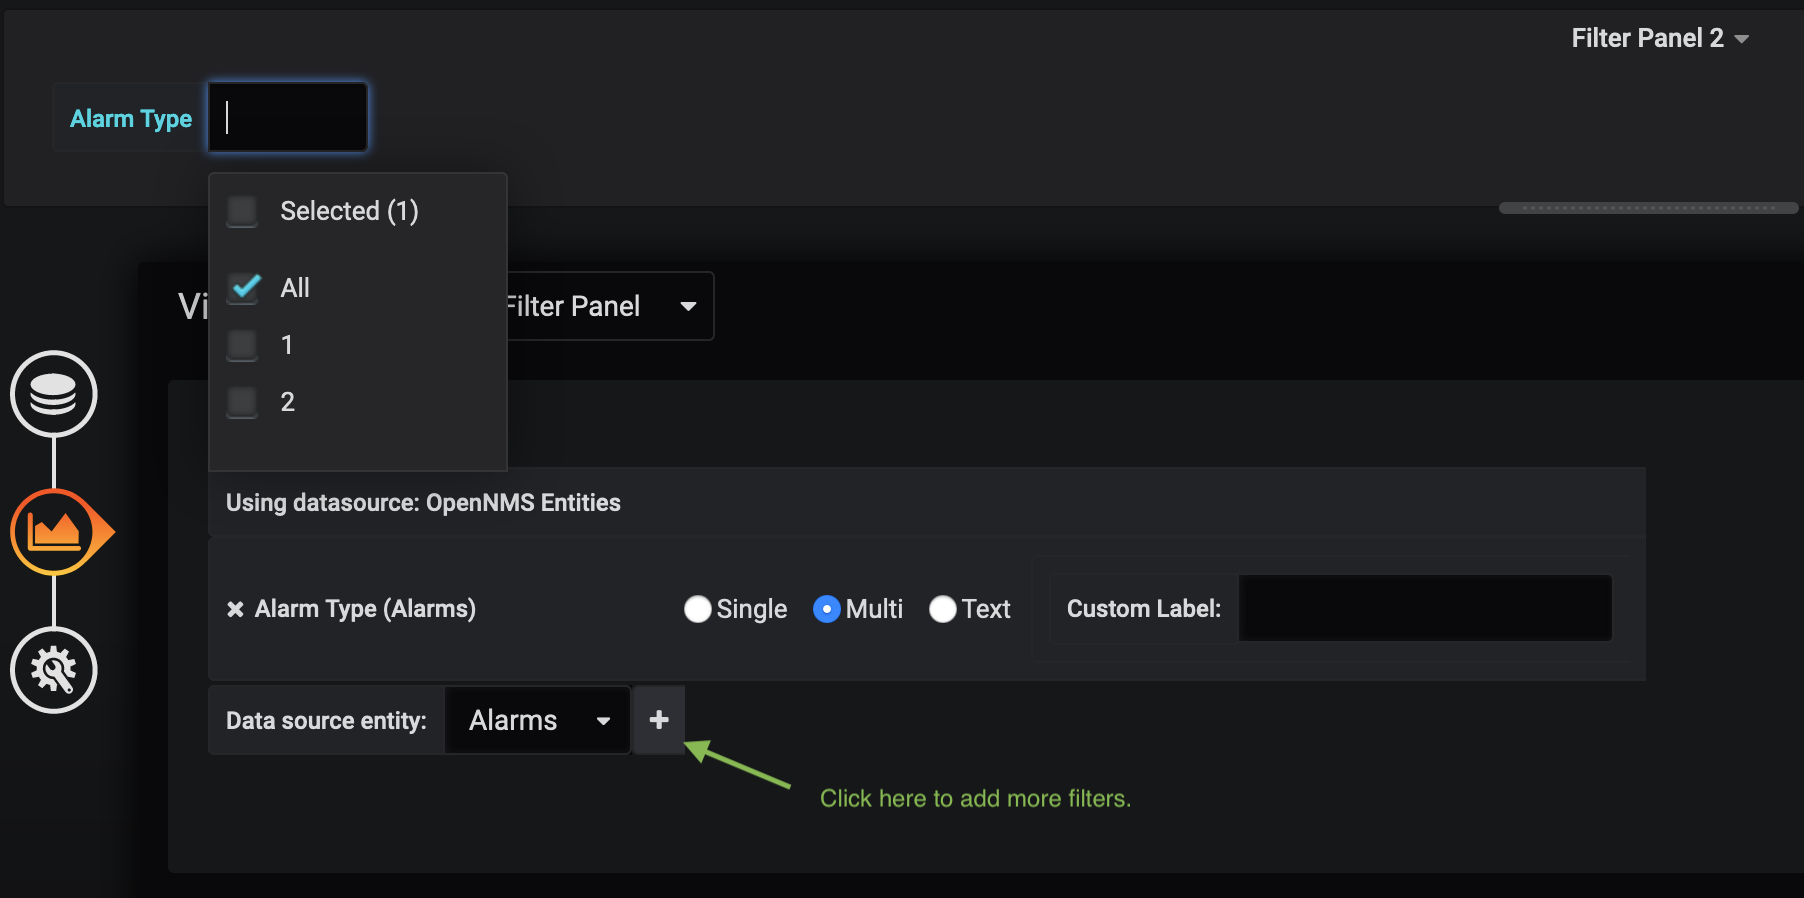
Specify information about the appearance of your filter field, including whether it is a drop-down list or a text field, and a custom label, if desired:
-
Repeat steps 4–7 to add additional filters.
-
In the left menu, click the General icon to change the name of the filter panel and specify additional information.
-
In the top-right menu, click the Save Dashboard icon.
The filter panel appears on the dashboard:
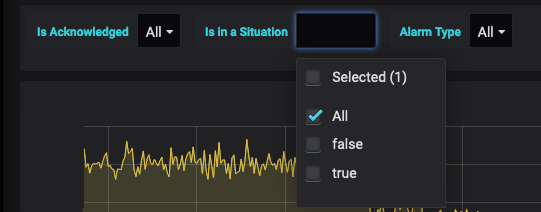
Selections that you make here will impact all panels in the dashboard that use an entities datasource. You can drag the filter panel to appear anywhere on your dashboard.