Flows
Flows refers to the summary of network traffic sent by network devices (switches, routers, and so on). This information includes, but is not limited to, source and destination address, source and destination port, octet count, and duration of activity. Collecting and analyzing flows data provides a picture of network usage and helps to diagnose network issues. Persisting flows for long-term storage can aid in forensic analysis.
Meridian provides the following:
-
A platform to collect, persist, and visualize flows, with support for NetFlow versions 5 and 9, IPFIX, and sFlow
-
Inventory enrichment (mapping to OpenNMS nodes)
-
Application classification
-
Horizontal scaling
-
Enterprise reporting (generate PDF reports)
-
Top K statistics by interface, application, host, conversation with QoS
See the Telemetry section for a list of supported protocols.
This section presents a set of procedures to set up flows that progress from a basic environment to more complex:
-
Basic setup (out-of-the-box)
-
Flows data in a distributed/remote network (add a Minion)
-
Processing large volume of flows data (add Sentinel to scale)
-
Issues with flows at scale and queries taking too long (add the OpenNMS streaming analytics tool)
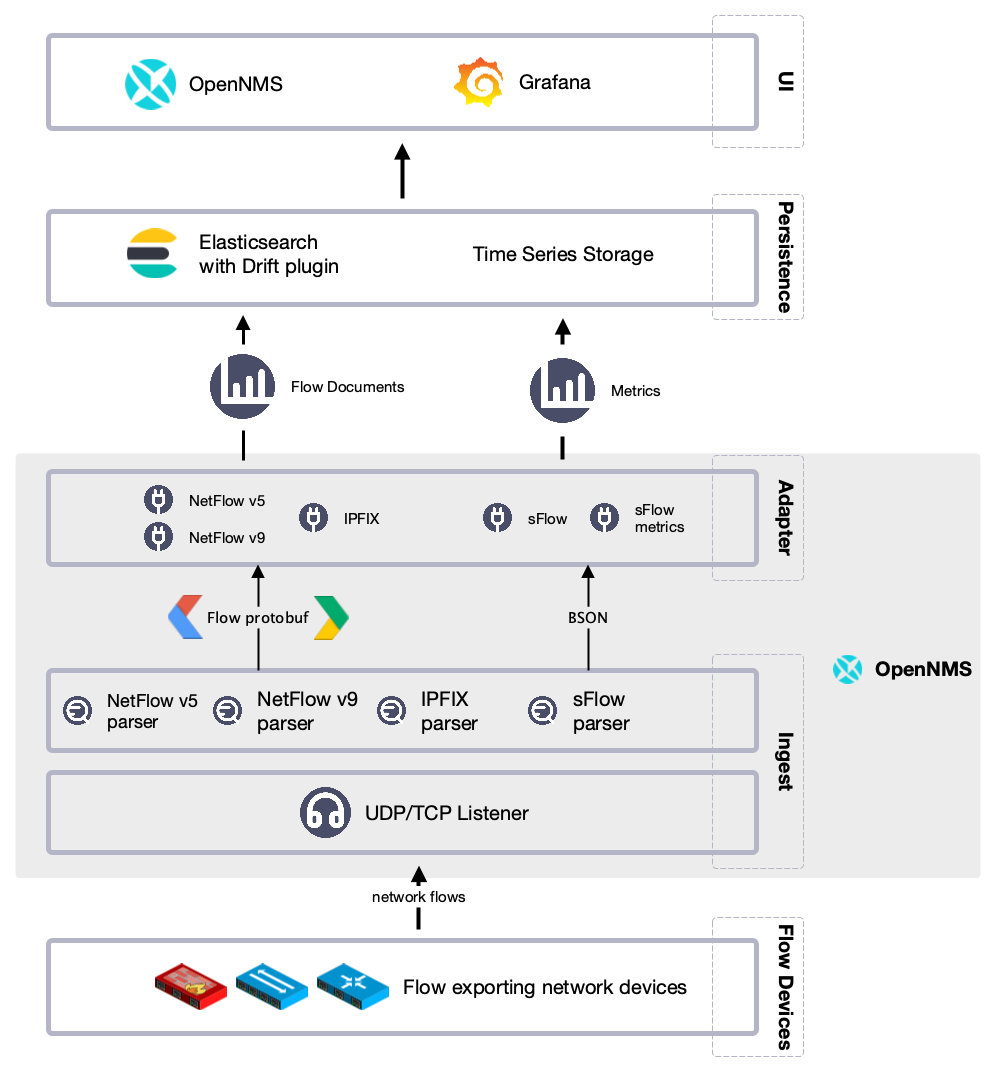
How it works
At a high level, with a basic setup, OpenNMS processes flows as follows:
-
Telemetryd receives and decodes flows on Meridian.
-
Telemetryd adapters convert the flows to a canonical flow model.
-
Flows are enriched:
-
The classification engine tags flows and groups them under a name based on a set of rules.
-
Metadata related to associated nodes (such as IDs and categories) are also added to the flows.
-
-
Enriched flows are persisted in Elasticsearch and/or forwarded to Kafka.
-
You can use the OpenNMS streaming analytics tool to aggregate flows and output aggregates to Elasticsearch, Cortex, or Kafka
-
The REST API supports generating both summaries and time series data from the flows or flow aggregates stored in Elasticsearch.
-
Use OpenNMS Helm to visualize flows and/or flow aggregates:
-
Use the "Flow Deep Dive" dashboard with an OpenNMS Flow datasource to visualize flows and flow aggregates stored in Elasticsearch.
-
Use the "Cortex Flow Deep Dive" dashboard with a Prometheus datasource to access flow aggregates stored in Cortex.
-