About the OpenNMS Plugin for Grafana
The OpenNMS Plugin for Grafana lets you create flexible dashboards to visualize and interact with data stored by OpenNMS. It works with Grafana to customize and display fault management, performance management, and flow management data from OpenNMS Horizon and Meridian.
You can create and customize dashboards to display the data that you want to see—alarms, outages, key performance indicators—in a way that best meets your needs.
How does it work?
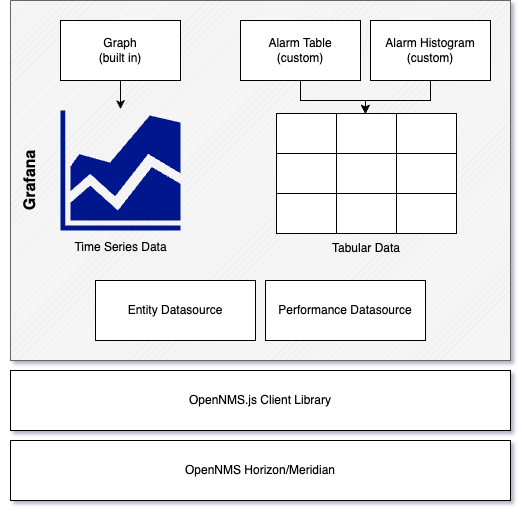
The plugin includes datasources for retrieving fault management, performance management, and flow management data from an existing OpenNMS instance. It also includes specialized panels that let you display and interact with the data. Because you can aggregate data from multiple OpenNMS instances, you can use the plugin to create a single view that encompasses your distributed deployments.
All interactions between the plugin and OpenNMS are done via the REST API. No fault management or performance management data is stored within the plugin or Grafana.
Fault management
Fault management is the process of identifying problems related to network devices and systems, and managing their lifecycle. OpenNMS uses a combination of events, outages, alarms, and notifications to do this. The plugin supports filtering, retrieving, displaying, and performing actions against alarms that OpenNMS generates.
| If you are not familiar with alarms in OpenNMS, you can learn more from OpenNMS 101 - Module 5: Alarms on YouTube. |
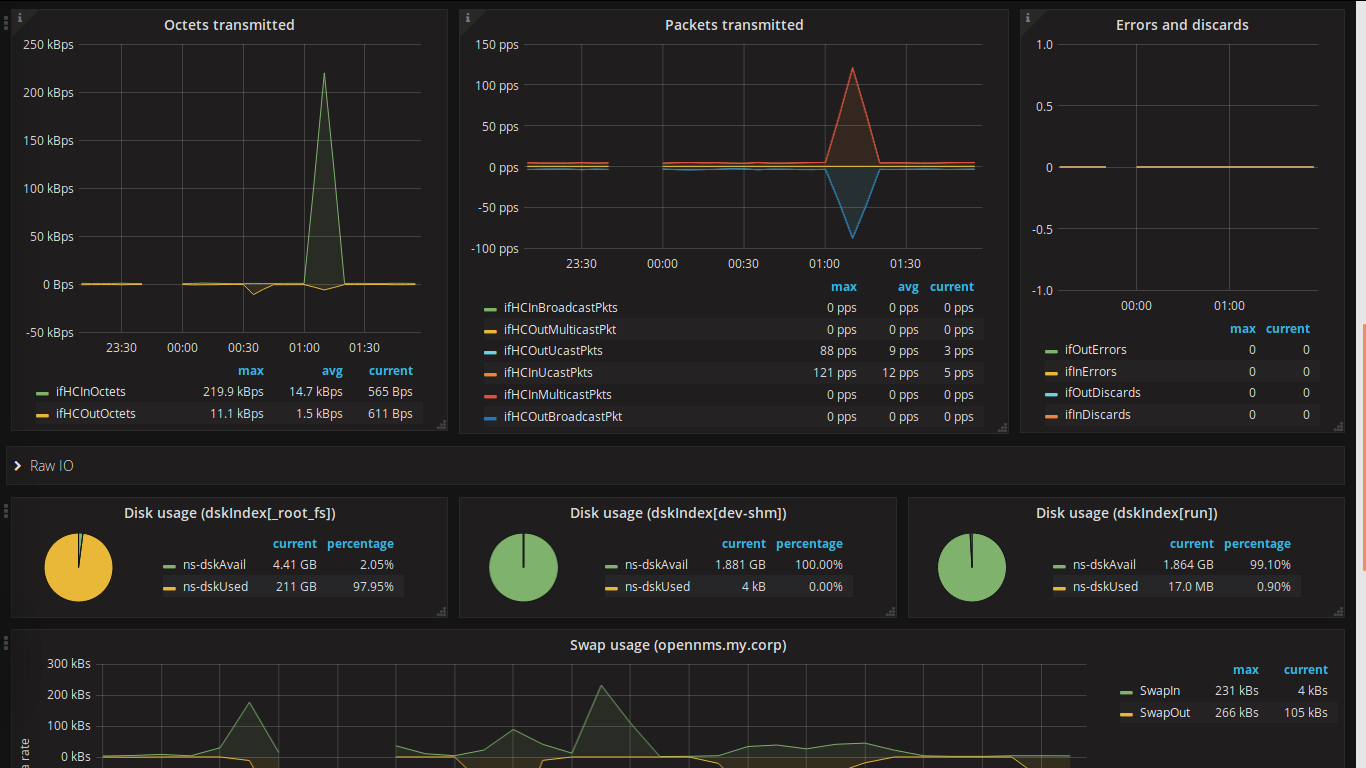
Performance management
Performance management is the process of gathering, storing, and analyzing system health using a series of metrics. You can use these metrics for historical analysis, or to automatically generate faults when certain conditions or thresholds are met. The plugin can retrieve and visualize metric data that OpenNMS stores.
| If you are not familiar with how OpenNMS collects and stores data, you can learn more from OpenNMS 101 - Module 11: Data Collection on YouTube. |
Flow management
Flow management is the process of managing data flows between devices or nodes on a network. The plugin can visualize flow metric data that OpenNMS stores.
For an example of how you can visualize flows, see Flow Deep-Dive Dashboard.